
Canada Border Services Agency: Q3 Quarterly Financial Report—For the quarter ended December 31, 2023
On this page
- 1. Introduction
- 2. Highlights of fiscal quarter and fiscal year-to-date (YTD) results
- 3. Risks and uncertainties
- 4. Significant changes in relation to operations, personnel and programs
- 5. Approval by senior officials
- 6. Table 1: Statement of authorities (unaudited)
- 7. Table 2: Departmental budgetary expenditures by standard object (unaudited)
1. Introduction
This Quarterly Financial Report (QFR) has been prepared as required by section 65.1 of the Financial Administration Act and in the form and manner prescribed by the Treasury Board. This quarterly report should be read in conjunction with the Main Estimates.
Information on the raison d'être, mandate, role and core responsibilities of the Canada Border Services Agency (CBSA) can be found in Part III Departmental Plan and Part II of the Main Estimates.
The QFR has not been subjected to an external audit or review, but has been reviewed internally by the Departmental Audit Committee Chair.
1.1 Basis of presentation
This quarterly report has been prepared by management using an expenditure basis of accounting. The accompanying statement of authorities (Table 1) includes the department's spending authorities granted by Parliament, and those used by the department consistent with the Main Estimates and Supplementary Estimates (as applicable) for the to and to fiscal years. This quarterly report has been prepared using a special purpose financial reporting framework designed to meet financial information needs with respect to the use of spending authorities.
The authority of Parliament is required before money can be spent by Government departments. Approvals are given in the form of annually approved limits through appropriation acts, or through legislation in the form of statutory spending authority for specific purposes.
When Parliament is dissolved for the purposes of a general election, section 30 of the Financial Administration Act authorizes the Governor General, under certain conditions, to issue a special warrant authorizing the Government to withdraw funds from the consolidated revenue fund. A special warrant is deemed to be an appropriation for the fiscal year in which it is issued.
The department uses the full accrual method of accounting to prepare and present its annual departmental financial statements that are part of the departmental results reporting process. However, the spending authorities voted by Parliament remain on an expenditure basis.
2. Highlights of fiscal quarter and fiscal year-to-date (YTD) results
This section highlights the significant items that contributed to the net increase or decrease in resources available for the year and actual expenditures as of the quarter ended .
Graph 1: Comparison of net budgetary authorities and expenditures as of , and (in thousands $)
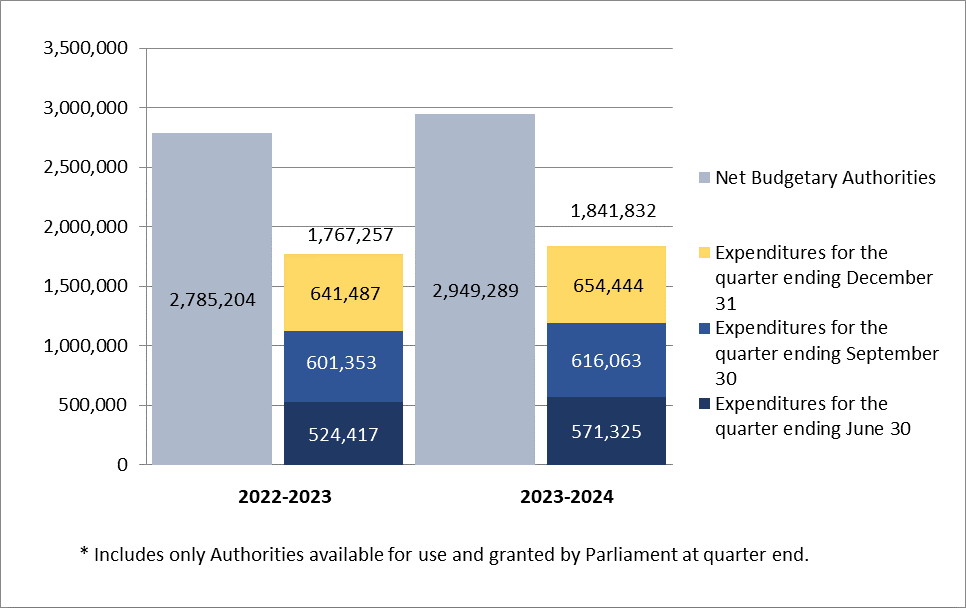
Image description
Graph 1: Comparison of net budgetary authorities and expenditures as of , and (in thousands $)
| to | to | |
|---|---|---|
| Net budgetary authorities | 2,785,204 | 2,949,289 |
| Expenditures for the quarter ending | 641,487 | 654,444 |
| Expenditures for the quarter ending | 601,353 | 616,063 |
| Expenditures for the quarter ending | 524,417 | 571,325 |
| Total expenditures to date | 1,767,257 | 1,841,832 |
| Includes only Authorities available for use and granted by Parliament at quarter end. | ||
2.1 Significant changes to authorities
For the period ending , the authorities provided to the CBSA comprise the Main Estimates, Supplementary Estimates B, Treasury Board (TB) central votes and any unused spending authorities carried forward from the previous fiscal year.
The statement of authorities (Table 1) presents a net increase of $164.1 million or 5.9% of the Agency's total authorities of $2,949.3 million on , compared to $2,785.2 million total authorities at the same quarter last year.
This net increase in the authorities available for use is the result of an increase in Vote 1 – Operating Expenditures of $169.0 million, a decrease in Vote 5 – Capital Expenditures of $4.8 million, and a decrease in Statutory Authority of $0.1 million.
Vote 1: Operating
The Agency's Vote 1 Operating increased by $169.0 million or 7.4%, which is attributed to the net effect of the following significant items (excluding the statutory authorities):
The main increases contributing to the changes in operating funding include:
- $349.0 million in net increases as described in the CBSA Quarterly Financial Report for the quarter ended . For ease of reference, the following provides a summary of the items reflected in the above mentioned report.
- The main increases contributing to the changes in operating funding include:
- $124.6 million to Modernize, and sustain travel and trade at Canadian borders;
- $57.4 million for Canada's asylum irregular migration system;
- $40.9 million in reprofiled funding for various initiatives to future fiscal years;
- $32.2 million for Gordie Howe International Bridge (GHIB);
- $25.3 million for the Resettlement of Afghan refugees;
- $21.1 million for National guard contracts;
- $15.7 million for Irregular migration in the Americas;
- $11.0 million in various Transfers;
- $8.0 million for Cannabis in Canada;
- $5.7 million for Entry-Exit;
- $5.5 million for compensation adjustments.
- The main decreases contributing to the changes in operating funding include:
- $2.0 million reduction for Land Border Crossing Project (LBCP);
- $1.5 million reduction for Drug Impaired Driving (DID);
- $1.2 million reduction for Security Screening Automation (SSA);
- $1.0 million reduction for Canada's Firearms Control Framework.
- The main increases contributing to the changes in operating funding include:
- $28.9 million increase in collective agreements; and
- $4.9 million increase for CBSA Assessment and Revenue Management (CARM) Project.
The main decreases contributing to the changes in operating funding include:
- $173.3 million decrease as approved in 2023-24 Supplementary Estimates B, which can be mainly attributed to the following items:
- $131.9 million decrease in funding to modernize travel and travel at Canadian borders;
- $27.3 million decrease due to an increase in transfers to other organizations;
- $21.3 million decrease in funding for resettlement of Afghan refugees;
- $6.6 million decrease in funding to support Ukrainians; and
- The decrease is offset by $15.7 million increase in funding for temporary Resident processing.
- $39.3 million in decreases as described in the CBSA Quarterly Financial Report for the quarter ended . For ease of reference, the following provides a summary of the items reflected in the above mentioned report.
- $38.8 million in decreases due to a smaller carry forward of unused spending authorities; and
- $0.6 million decrease for the Application Modernization Initiative.
- $1.2 million decrease in paylist allocations.
Vote 5: Capital
The Agency's Vote 5 Capital decreased by $4.8 million or 1.8%, which is attributed to the net effect of the following significant items:
The main decreases contributing to the changes in capital funding include:
- $16.7 million decrease as approved in 2023-24 Supplementary Estimates B, which is mainly due to the following items:
- $39.6 million decrease in funding to modernize travel and travel at Canadian borders;
- $4.5 million decrease in funding for security screening automation;
- $2.0 million decrease in funding for the resettlement of Afghan refugees; and
- The decrease is offset by $32.0 million increase in transfers from other organizations.
- $4.9 million decrease for CARM Project.
The main increases contributing to the changes in capital funding include:
- $9.4 million in increases as described in the CBSA Quarterly Financial Report for the quarter ended June 30, 2023. For ease of reference, the following provides a summary of the items reflected in the above mentioned report.
- The main increases contributing to the changes in capital funding include:
- $39.0 million for Modernize, and sustain travel and trade at Canadian borders;
- $14.1 million for Land Border Crossing Project;
- $10.3 million for Border Infrastructure (Lacolle);
- $8.8 million for Gordie Howe International Bridge Project (GHIB).
- The main decreases contributing to the changes in capital funding include:
- $38.3 million reduction for CBSA Assessment and Revenue Management (CARM);
- $10.4 million reduction for Marine Container Examination Facility (MCEF);
- $6.9 million reduction for Passenger Protect Program;
- $6.1 million reduction for Entry Exit;
- $5.1 million reduction in reprofiled funding for various initiatives to future fiscal years.
- The main increases contributing to the changes in capital funding include:
- $7.4 million in increases due to a larger carry forward of unused spending authorities as described in the CBSA Quarterly Financial Report for the quarter ended .
Statutory authorities
The Agency's Statutory Authority related to the employee benefit plan (EBP) decreased by $0.1 million, or 0.1% from the previous year.
2.2 Explanations of significant variances in expenditures from previous year
As indicated in the statement of authorities (Table 1), the Agency's expenditures for year-to-date, at quarter ended , were $1,841.8 million, as compared to $1,767.3 million for year-to-date, quarter ended . The net increase of $74.6 million or 4.2% in expenditures is mainly due to the following items:
- Increase of $79.2 million or 5.1% in Vote 1 Operating Expenditures year-to-date used at quarter end. The increase in expenditures is mainly attributed to a $59.6 million increase in salaries, meal premium and overtime pay, due to the newly negotiated collective agreements and an increase in overtime hours worked. In addition, there is a $8.7 million increase in property management fees and a $4.8 million increase in informatics services.
- Decrease of $16.3 million or 24.6% in Vote 5 Capital Expenditures year-to-date used at quarter end, mainly attributable to:
- $6.4 million decrease in Information Technology consultants as a result of an effort to reduce professional services expenditures as part of the Refocusing Government Spending exercise;
- $3.4 million decrease in software and laboratory and medical equipment expenses for Firearms Smuggling and Passenger Protect Program;
- $2.7 million decrease in Image/Video Equipment for Closed Circuit Television; and
- $2.4 million decrease in facilities capital projects, such as Land Border Crossing Project and Port of Entry infrastructure.
- Increase of $11.7 million or 7.3% in statutory expenditures, tied to increased salaries.
As indicated in the departmental budgetary expenditures by standard objects (Table 2), the net increase of $74.6 million by standard object is mainly attributed to:
- Increase of $85.2 million for Personnel due to salaries, Canada/Quebec Pension Plan, meal premium and overtime pay.
- Increase of $5.8 million for Transportation and Communications due to travel for irregular migration and incremental asylum.
- Increase of $4.0 million in Repair and Maintenance can be attributed to repair of computer equipment for eManifest and facilities non-capital projects for Irregular Migration and Incremental Asylum.
- Decrease of $10.6 million in Acquisition of machinery and equipment, which is related to computer software, laboratory and medical equipment and image/video equipment expense.
- Decrease of $2.8 million in Other Subsidies and Payments, which can be mainly attributed to the settlements of damage and other claims against the Crown.
- Decrease of $2.7 million for Professional and special services due to an intentional reduction in IT consultants.
- Decrease of $2.4 million in Acquisition of Land, Buildings and Equipment related to Facilities Capital Projects for LBCP, Port of Entry infrastructure and All weather facility.
- Increase of $3.3 million in Vote netted revenues (See below for more details).
Graph 2: Comparison of vote netted revenue and revenue collected as of , and (in thousands $)
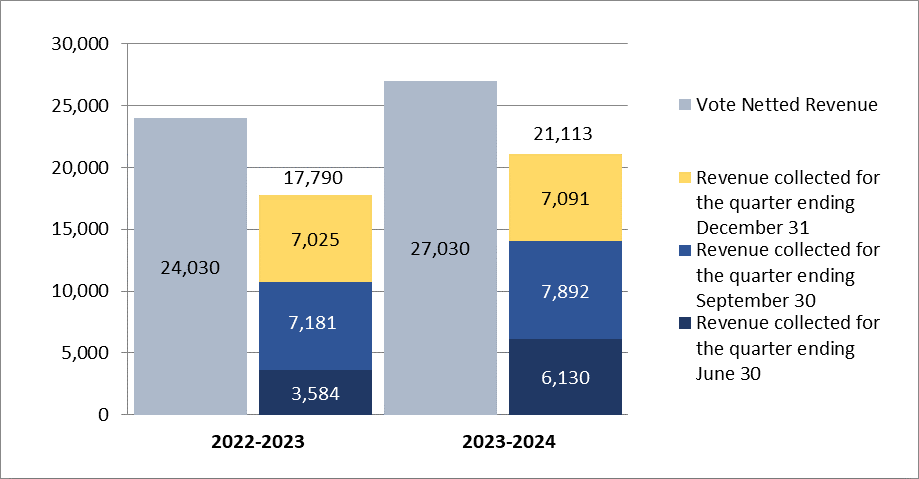
Image description
Graph 2: Comparison of vote netted revenue and revenue collected as of , and (in thousands $)
| to | to | |
|---|---|---|
| Vote netted revenue | 24,030 | 27,030 |
| Revenue collected for the quarter ending | 7,025 | 7,091 |
| Revenue collected for the quarter ending | 7,181 | 7,892 |
| Revenue collected for the quarter ending | 3,584 | 6,130 |
| Total revenue collected to date | 17,790 | 21,113 |
The planned revenue from the sales of services reflects the Agency's revenue respending authority. The year-to-date revenue from the charge of services has increased by $3.3 million or 18.7% compared to last year, due to the reopening of borders and increased travel after the lifting of COVID-19 restrictions. The increased travel has resulted in higher regular revenues collected in programs such as Nexus.
3. Risks and uncertainties
In , the annual inflation rate rose to levels not seen in decades. Despite showing signs of levelling off in Q3 to , there have been upward pressures on certain costs. When combined with the Refocusing Government Spending exercise over the next few years, the Agency's exposure to risks that relate to achieving its goals in a timely fashion and within allocated budgets could increase if not properly mitigated.
For example, the Agency is pursuing several large transformational technology and physical infrastructure projects; most are multi-year in nature and represent substantial investments. Because the CBSA depends on other government departments and/or external stakeholders for the development and implementation of many of these projects, any delays due to limited labour availability and affordability within and outside the Agency can have an impact on these major projects. Even short delays may incur additional costs for materials, commodities and other market rate priced services.
Despite these conditions, the Agency has met key deadlines and deliverables on many of the major projects currently underway and is on track for the next set of deliverables. The Agency strives to mitigate financial risks by risk-rating its projects, conducting periodic project reviews, and by holding regular budget discussions. Such activities are informed and supported by both the Agency's quarterly integrated project reporting and enterprise risk reporting processes.
4. Significant changes in relation to operations, personnel and programs
4.1 Key senior personnel
Andrew Francis, Associate Vice-President of the Finance and Corporate Management Branch, left the Agency on to join Parks Canada as Vice-President of Finance and Chief Financial Officer. For the time being, the Agency is not planning to fill this position.
4.2 Operations
With the removal of all travel restrictions due to COVID-19 on , traveler volumes rose considerably in 2023, the first year without these restrictions since 2019. From to , 73.7 million travelers crossed the border with minimal wait times, approximately 46% more than the same period last year. Furthermore, the testing launch of the CBSA Assessment and Revenue Management (CARM) project occurred in with a limited number of industry partners who expressed interest in testing their internal processes and pursuing the certification of their software. CARM will become the system of record by for the collection of duties and taxes for commercial goods imported into Canada.
The Laboratories Canada initiative, an investment of $2.8 billion by the Government, progressed toward building new laboratory facilities to replace the current CBSA Lab, as Public Services and Procurement Canada invited five architectural and engineering firms and five construction management firms to submit a Request for Proposal for the construction of two facilities in Ottawa, slated to begin in 2025.
Finally, the Agency has undertaken infrastructure upgrades, as well as operational and staffing enhancements, for the short-term housing of high-risk detainees, as all provinces have announced that they will stop housing high-risk immigrant detainees in their correctional facilities over the course of the coming months and year, with some having already stopped accepting new detainees in .
The CBSA invests in a number of information technology (IT) projects as part of its transformation agenda towards creating a more modernized organization. Please find enclosed a list of key IT projects with a budget over $1 million.
5. Approval by senior officials
Approved by:
Erin O'Gorman
President
Ted Gallivan
Executive Vice-President
Ottawa, Canada
Date:
Jonathan Moor
Chief Financial Officer
Ottawa, Canada
Date:
6. Table 1: Statement of authorities (unaudited)
| Total available for use for the year ending Tablenote 1 ($ thousands) | Used during the quarter ended ($ thousands) | Year-to-date used at quarter end ($ thousands) | |
|---|---|---|---|
| Vote 1: Operating expenditures | 2,451,775 | 572,395 | 1,620,254 |
| Vote 5: Capital expenditures | 265,698 | 24,879 | 49,989 |
| Statutory authority: Contributions to employee benefit plans | 231,816 | 56,933 | 170,799 |
| Statutory authority: Refunds of amounts credited to revenues in previous years | 0 | 5 | 31 |
| Statutory authority: Spending of proceeds from the disposal of surplus Crown assets | 0 | 232 | 759 |
| Total budgetary authorities | 2,949,289 | 654,444 | 1,841,832 |
| Non-budgetary authorities | 0 | 0 | 0 |
| Total authorities | 2,949,289 | 654,444 | 1,841,832 |
| Total available for use for the year ending Tablenote 2 ($ thousands) | Used during the quarter ended ($ thousands) | Year-to-date used at quarter end ($ thousands) | |
|---|---|---|---|
| Vote 1: Operating expenditures | 2,282,786 | 557,737 | 1,541,068 |
| Vote 5: Capital expenditures | 270,497 | 30,476 | 66,329 |
| Statutory authority: Contributions to employee benefit plans | 231,921 | 53,094 | 159,282 |
| Statutory authority: Refunds of amounts credited to revenues in previous years | 0 | 0 | 3 |
| Statutory authority: Spending of proceeds from the disposal of surplus Crown assets | 0 | 180 | 575 |
| Total budgetary authorities | 2,785,204 | 641,487 | 1,767,257 |
| Non-budgetary authorities | 0 | 0 | 0 |
| Total authorities | 2,785,204 | 641,487 | 1,767,257 |
7. Table 2: Departmental budgetary expenditures by standard objects (unaudited)
| Planned expenditures for the year ending Tablenote 3 ($ thousands) | Expended during the quarter ended ($ thousands) | Year-to-date used at quarter end ($ thousands) | |
|---|---|---|---|
| Expenditures | |||
| Personnel | 1,818,994 | 492,947 | 1,438,552 |
| Transportation and communications | 100,824 | 15,980 | 41,908 |
| Information | 4,265 | 1,560 | 3,157 |
| Professional and special services | 650,975 | 109,860 | 282,382 |
| Rentals | 20,093 | 2,474 | 6,418 |
| Repair and maintenance | 56,463 | 17,082 | 30,153 |
| Utilities, materials and supplies | 45,240 | 4,876 | 13,581 |
| Acquisition of land, buildings and works | 81,844 | 8,095 | 13,425 |
| Acquisition of machinery and equipment | 134,005 | 8,359 | 27,049 |
| Transfer payments | 0 | 0 | 0 |
| Other subsidies and payments | 63,617 | 302 | 6,320 |
| Total gross budgetary expeditures | 2,976,320 | 661,535 | 1,862,945 |
| Less revenues netted against expenditures | |||
| Sales of services | 27,030 | 7,096 | 21,144 |
| Other revenue | 0 | -5 | -31 |
| Total revenues netted against expenditures | 27,030 | 7,091 | 21,113 |
| Total net budgetary expenditures | 2,949,290 | 654,444 | 1,841,832 |
| Planned expenditures for the year ending Tablenote 4 ($ thousands) | Expended during the quarter ended ($ thousands) | Year-to-date used at quarter end ($ thousands) | |
|---|---|---|---|
| Expenditures | |||
| Personnel | 1,847,214 | 465,219 | 1,353,397 |
| Transportation and communications | 58,944 | 15,113 | 36,151 |
| Information | 2,826 | 310 | 1,604 |
| Professional and special services | 585,202 | 118,578 | 285,049 |
| Rentals | 17,022 | 3,251 | 7,557 |
| Repair and maintenance | 62,194 | 14,678 | 26,125 |
| Utilities, materials and supplies | 32,997 | 5,043 | 12,565 |
| Acquisition of land, buildings and works | 40,353 | 7,524 | 15,829 |
| Acquisition of machinery and equipment | 119,565 | 19,398 | 37,655 |
| Transfer payments | 0 | 0 | 0 |
| Other subsidies and payments | 42,917 | -602 | 9,115 |
| Total gross budgetary expenditure | 2,809,234 | 648,512 | 1,785,047 |
| Less revenues netted against expenditures | |||
| Sales of services | 24,030 | 7,025 | 17,793 |
| Other revenue | 0 | 0 | -3 |
| Total revenues netted against expenditures | 24,030 | 7,025 | 17,790 |
| Total net budgetary expenditures | 2,785,204 | 641,487 | 1,767,257 |
- Date modified: