
Canada Border Services Agency: Quarterly Financial Report—For the quarter ended June 30, 2023
On this page
- 1. Introduction
- 2. Highlights of fiscal quarter and fiscal year-to-date (YTD) results
- 3. Risks and uncertainties
- 4. Significant changes in relation to operations, personnel and programs
- 5. Approval by senior officials
- 6. Table 1: Statement of authorities (unaudited)
- 7. Table 2: Departmental budgetary expenditures by standard object (unaudited)
1. Introduction
This Quarterly Financial Report (QFR) has been prepared as required by section 65.1 of the Financial Administration Act and in the form and manner prescribed by the Treasury Board. This quarterly report should be read in conjunction with the Main Estimates, Canada's Economic Action Plan 2023 (Budget 2023) and Canada's COVID-19 Economic Response Plan.
Information on the raison d'être, mandate, role and core responsibilities of the Canada Border Services Agency (CBSA) can be found in Part III Departmental Plan and Part II of the Main Estimates.
The QFR has not been subjected to an external audit or review, but has been reviewed internally by the Departmental Audit Committee.
1.1 Basis of presentation
This quarterly report has been prepared by management using an expenditure basis of accounting. The accompanying statement of authorities (Table 1) includes the department's spending authorities granted by Parliament, and those used by the department consistent with the Main Estimates and Supplementary Estimates (as applicable) for the to and to fiscal years. This quarterly report has been prepared using a special purpose financial reporting framework designed to meet financial information needs with respect to the use of spending authorities.
The authority of Parliament is required before money can be spent by the Government. Approvals are given in the form of annually approved limits through appropriation acts, or through legislation in the form of statutory spending authority for specific purposes.
When Parliament is dissolved for the purposes of a general election, section 30 of the Financial Administration Act authorizes the Governor General, under certain conditions, to issue a special warrant authorizing the Government to withdraw funds from the consolidated revenue fund. A special warrant is deemed to be an appropriation for the fiscal year in which it is issued.
The department uses the full accrual method of accounting to prepare and present its annual departmental financial statements that are part of the departmental results reporting process. However, the spending authorities voted by Parliament remain on an expenditure basis.
2. Highlights of fiscal quarter and fiscal year-to-date (YTD) results
This section highlights the significant items that contributed to the net increase or decrease in resources available for the year and actual expenditures as of the quarter ended .
Graph 1: Comparison of net budgetary authorities and expenditures as of , and (in thousands $)
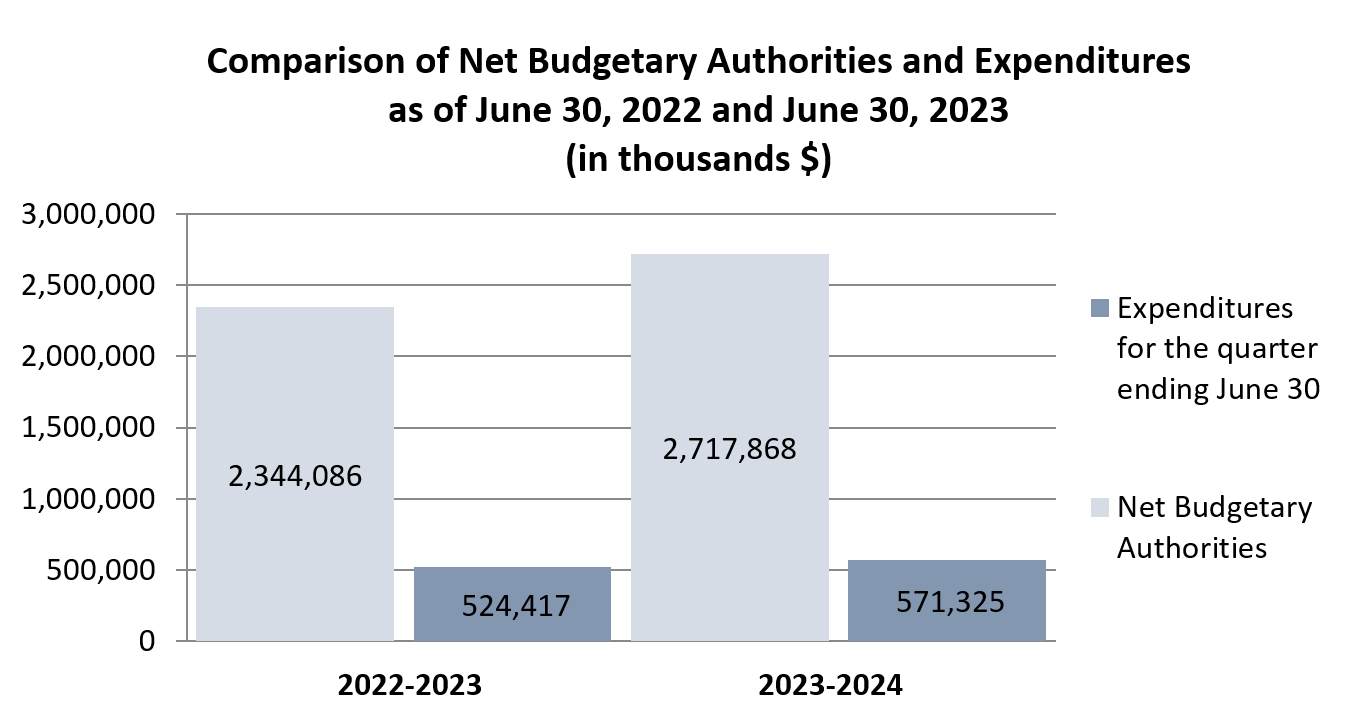
Image description
Graph 1: Comparison of net budgetary authorities and expenditures as of , and (in thousands $)
| to | to | |
|---|---|---|
| Net budgetary authorities | 2,344,086 | 2,717,868 |
| Expenditures for the quarter ending | 524,417 | 571,325 |
2.1 Significant changes to authorities
For the period ending , the authorities provided to the CBSA are comprised of the Main Estimates.
The statement of authorities (Table 1) presents a net increase of $373.8 million or 15.9% of the Agency's total authorities of $2,717.9 million on , compared to $2,344.1 million total authorities at the same quarter last year.
This net increase in the authorities available for use is the result of an increase in Vote 1 – Operating Expenditures of $349.0 million, an increase in Vote 5 – Capital Expenditures of $9.4 million and an increase in budgetary statutory authorities of $15.4 million, as detailed below.
Vote 1: Operating
The Agency's Vote 1 increased by $349.0 million or 17.8% (excluding the statutory authorities), compared to the same period last fiscal year.
In to , the Agency received $1,958.6 million as Main Estimates in comparison to the Vote 1 authorities of $2,307.6 million in to , results in a net increase of $349.0M or 17.8%. The main increases contributing to the changes in operating funding include:
- $124.6 million to Modernize, and sustain travel and trade at Canadian borders
- $57.4 million for Canada's asylum irregular migration system
- $40.9 million in reprofiled funding for various initiatives to future fiscal years
- $32.2 million for Gordie Howe International Bridge (GHIB)
- $25.3 million for the Resettlement of Afghan refugees
- $21.1 million for National guard contracts
- $15.7 million for Irregular migration in the Americas
- $11.0 million in various Transfers
- $8.0 million for Cannabis in Canada
- $5.7 million for Entry-Exit
- $5.5 million for compensation adjustments
The main decreases contributing to the changes in operating funding include:
- $2.0 million reduction for Land Border Crossing Project (LBCP)
- $1.5 million reduction for Drug Impaired Driving (DID)
- $1.2 million reduction for Security Screening Automation (SSA)
- $1.0 million reduction for Canada's Firearms Control Framework
Vote 5: Capital
The Agency's Vote 5 increased by $9.4 million or 5.4% (excluding the statutory authorities), compared to the same period last fiscal year.
In to , the Agency received $173.1 million as Main Estimates in comparison to the Vote 5 authorities $182.5 million in to , results in a net increase of $9.4M or 5.4%. The main increases contributing to the changes in capital funding include:
- $39.0 million for Modernize, and sustain travel and trade at Canadian borders
- $14.1 million for Land Border Crossing Project
- $10.3 million for Border Infrastructure (Lacolle)
- $8.8 million for Gordie Howe International Bridge Project (GHIB)
The main decreases contributing to the changes in capital funding include:
- $38.3 million reduction for CBSA Assessment and Revenue Management (CARM)
- $10.4 million reduction for Marine Container Examination Facility (MCEF)
- $6.9 million reduction for Passenger Protect Program
- $6.1 million reduction for Entry Exit
- $5.1 million reduction in reprofiled funding for various initiatives to future fiscal years
Budgetary statutory authorities
The Agency's Statutory Authority related to the employee benefit plan (EBP) increased by $15.4 million, or 7.2% from the previous year.
2.2 Explanations of significant variances in expenditures from previous year
As indicated in the statement of authorities (Table 1), the Agency's expenditures for year-to-date, at quarter ends , were $571.3 million, as compared to $524.4 million for year-to-date, quarter ending . The net increase of $46.9 million or 8.9% in expenditures is mainly due to the following items:
- Increase of $44.6 million or 9.7% in Vote 1 Operating Expenditures year-to-date used at quarter ends. The increase in expenditures is mainly attributed to a $46.4 million increase in Operating expenses, such as shared services for CRA regional service and eManifest, other consulting services for CBSA Assessment and Revenue Management (CARM), computer software for Digital Workplace and Building Protection Services for National Guards Contract. In addition, there is a $18.2 million increase for meal premium and salaries accruals. The increase is offset by a $20.1 million decrease in prepaid legal, property management fees for Port of Entry infrastructure, settlements of claims and an increase of revenues.
- Decrease of $1.2 million or 12.6% in Vote 5 Capital Expenditures year-to-date used at quarter ends. The decrease in expenditures is mainly attributed to expenses for Information Technology Consultants related to ArriveCan.
- Increase of $3.8 million in statutory expenditures.
As indicated in the departmental budgetary expenditures by standard objects (Table 2), the net increase by standard object is mainly attributed to:
- Increase of $23.9 million for Professional and special services due to shared services for CRA regional service and eManifest and other consulting services expenses.
- Increase of $19.1 million for Personnel due to meal premium, salaries and pension expenses.
- Increase of $6.0 million in Acquisition of machinery and equipment, for computer software, personal computer equipment, and telecommunications. $3.7 million of the $6.0 million increase is attributed to the project Digital Workplace.
- Increase of $3.9 million for Transportation and Communications due to travel and mobile radios.
- Increase of $0.5 million for Utilities, Materials and Supplies due to miscellaneous materials and supplies and office stationery and supplies.
- Increase of $0.5 million for Information is mainly attributed to communications professional services expenses.
- Increase of $0.4 million in Rental for computer software and buildings.
- Decrease of $2.6 million in Other subsidies and payments which can be mainly attributed to the settlements of damage and other claims against the Crown.
- Decrease of $2.5 million in Repair and Maintenance can be attributed to repair of computer equipment, office furniture and facilities non-capital projects. $1.3 million of the $2.5 million decrease is attributed to the controlled funds for the National Computing Platform.
Graph 2: Comparison of vote netted revenue and revenue collected as of , and (in thousands $)
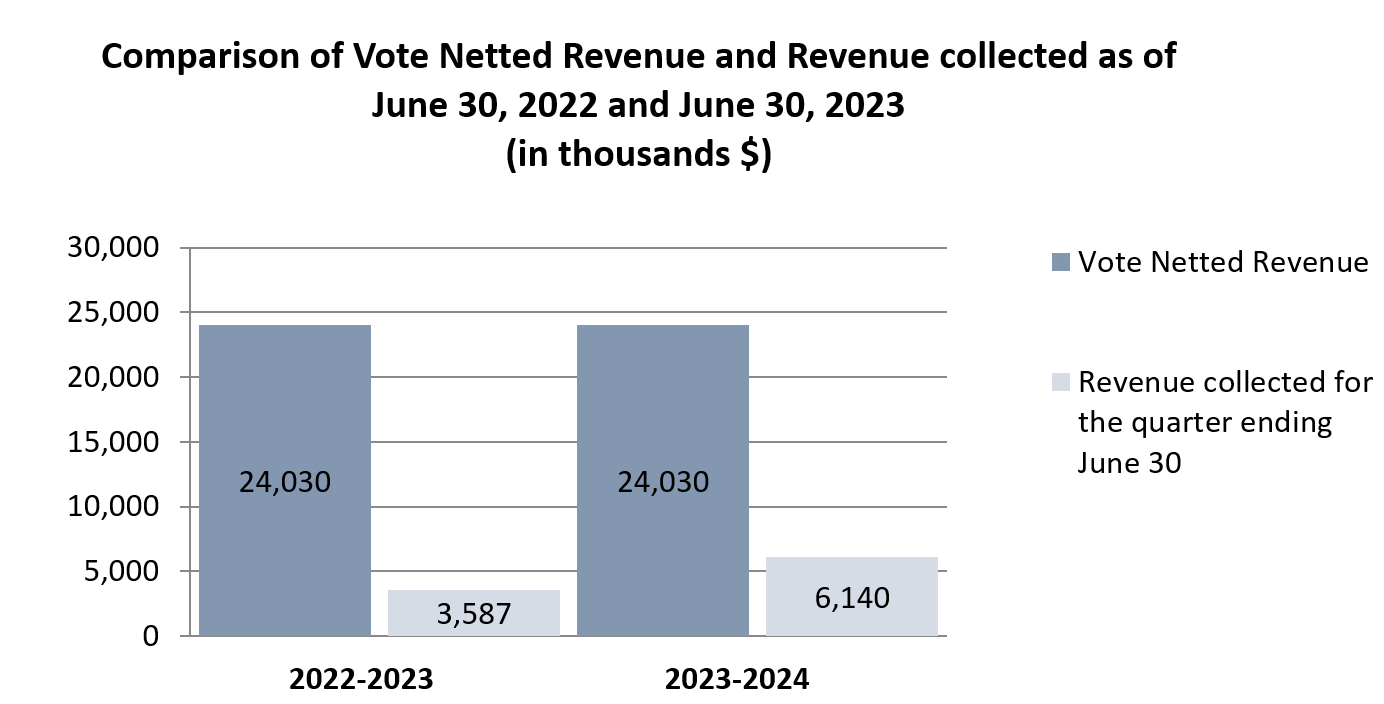
Image description
Graph 2: Comparison of vote netted revenue and revenue collected as of , and (in thousands $)
| to | to | |
|---|---|---|
| Vote netted revenue | 24,030 | 24,030 |
| Revenue collected for the quarter ending | 3,587 | 6,140 |
The planned revenue from the sales of services reflects the Agency's revenue respending authority. The year-to-date revenue from the charge of services has increased by $2.5 million or 71.1% due to the reopening of borders and increased travel after the lifting of COVID-19 restrictions.
3. Risks and uncertainties
Since the beginning of , the annual inflation rate rose to levels not seen in decades. Despite showing signs of levelling off in Q1 to , there have been upward pressure on certain costs. When combined with the Government of Canada's Refocusing Spending exercise over the next few years, the Agency's exposure to risks that relate to achieving its goals in a timely fashion and within allocated budgets could increase if not properly mitigated.
For example, the Agency is pursuing several large information technology (IT) and physical infrastructure projects; most are multi-year in nature and represent substantial investments. Because the CBSA depends on other government departments and/or external stakeholders for the development and implementation of many of these projects, any delays due to limited labour availability and affordability within and outside the Agency can have an impact on these major projects. Even short delays may incur additional costs for materials, commodities and other market rate priced services.
Despite these conditions, the Agency has met key deadlines and deliverables on many of the major projects currently underway and is on track for the next set of deliverables. The Agency strives to mitigate financial risks by risk-rating its projects, conducting periodic project reviews, and by holding regular budget discussions. Such activities are informed and supported by the Agency's quarterly integrated project reporting processes.
4. Significant changes in relation to operations, personnel and programs
4.1 Key senior personnel
Minh Doan, Chief Information Officer and Vice President of the Information, Science and Technology Branch (ISTB), left the Agency on to join the Treasury Board Secretariat.
Darryl Vleeming was appointed as the new Chief Information Officer and Vice-President of the Information, Science and Technology Branch (ISTB), effective .
Shirley Ivan was appointed as Special Advisor to the President and Executive Vice-President on .
Jacques Cloutier, Special Advisor to the President, retired from the public service and left the Agency on .
4.2 Operations
With the removal of all travel restrictions due to COVID-19 on , traveller volumes continue to rise during the summer travel season, the first one without these restrictions since . To help improve the flow of traffic, on , the launch of a new Verified Traveller program was announced, which will eventually replace the current Trusted Traveller program. The new program provides eligible travellers (including members of NEXUS and Global Entry) with select benefits at security screening checkpoints, such as keeping laptops, large electronics and compliant liquids and gels in their carry-on, and keeping their shoes, belt and light jacket on. As of , dedicated Verified Traveller screening lines were in place at select domestic and international checkpoints at the following international airports: Vancouver, Edmonton, Calgary, Winnipeg, Toronto-Pearson, and Montreal-Trudeau.
The Agency was affected by the Public Service Alliance of Canada's strike action between and , with the withdrawal of services from the PA, SV, TC, and EB bargaining groups.
The Agency manages a number of significant ongoing Information Technology (IT) projects with a budget over $1 million.
5. Approval by senior officials
Approved by:
Erin O'Gorman
President
Ted Gallivan
Executive Vice-President
Ottawa, Canada
Date: Ted Gallivan (on the behalf of Erin O'Gorman)
Jonathan Moor
Chief Financial Officer
Ottawa, Canada
Date:
6. Table 1: Statement of authorities (unaudited)
| Total available for use for the year ending Tablenote 1 ($ thousands) | Used during the quarter ended ($ thousands) | Year-to-date used at quarter end ($ thousands) | |
|---|---|---|---|
| Vote 1: Operating expenditures | 2,307,628 | 505,831 | 505,831 |
| Vote 5: Capital expenditures | 182,508 | 8,786 | 8,786 |
| Statutory authority: Contributions to employee benefit plans | 227,732 | 56,933 | 56,933 |
| Statutory authority: Refunds of amounts credited to revenues in previous years | 0 | 10 | 10 |
| Statutory authority: Spending of proceeds from the disposal of surplus Crown assets | 0 | -235 | -235 |
| Total budgetary authorities | 2,717,868 | 571,325 | 571,325 |
| Non-budgetary authorities | 0 | 0 | 0 |
| Total authorities | 2,717,868 | 571,325 | 571,325 |
| Total available for use for the year ending Tablenote 2 ($ thousands) | Used during the quarter ended ($ thousands) | Year-to-date used at quarter end ($ thousands) | |
|---|---|---|---|
| Vote 1: Operating expenditures | 1,958,649 | 461,190 | 461,190 |
| Vote 5: Capital expenditures | 173,061 | 10,051 | 10,051 |
| Statutory authority: Contributions to employee benefit plans | 212,376 | 53,094 | 53,094 |
| Statutory authority: Refunds of amounts credited to revenues in previous years | 0 | 3 | 3 |
| Statutory authority: Spending of proceeds from the disposal of surplus Crown assets | 0 | 79 | 79 |
| Total budgetary authorities | 2,344,086 | 524,417 | 524,417 |
| Non-budgetary authorities | 0 | 0 | 0 |
| Total authorities | 2,344,086 | 524,417 | 524,417 |
7. Table 2: Departmental budgetary expenditures by standard objects (unaudited)
| Amount for the year ending Tablenote 3 ($ thousands) | Amount for the quarter ended ($ thousands) | Year-to-date at quarter end ($ thousands) | |
|---|---|---|---|
| Expenditures | |||
| Personnel | 1,725,966 | 460,892 | 460,892 |
| Transportation and communications | 93,052 | 12,339 | 12,339 |
| Information | 3,113 | 1,249 | 1,249 |
| Professional and special services | 551,358 | 79,294 | 79,294 |
| Rentals | 19,004 | 1,943 | 1,943 |
| Repair and maintenance | 49,263 | 2,335 | 2,335 |
| Utilities, materials and supplies | 39,888 | 3,791 | 3,791 |
| Acquisition of land, buildings and works | 74,508 | 762 | 762 |
| Acquisition of machinery and equipment | 126,408 | 10,979 | 10,979 |
| Transfer payments | 0 | 0 | 0 |
| Other subsidies and payments | 59,338 | 3,871 | 3,871 |
| Total gross budgetary expeditures | 2,741,898 | 577,455 | 577,455 |
| Less revenues netted against expenditures | |||
| Sales of services | 24,030 | 6,140 | 6,140 |
| Other revenue | 0 | -10 | -10 |
| Total revenues netted against expenditures | 24,030 | 6,130 | 6,130 |
| Total net budgetary expenditures | 2,717,868 | 571,325 | 571,325 |
| Planned expenditures for the year ending Tablenote 4 ($ thousands) | Expended during the quarter ended ($ thousands) | Year-to-date used at quarter end ($ thousands) | |
|---|---|---|---|
| Expenditures | |||
| Personnel | 1,628,214 | 441,747 | 441,747 |
| Transportation and communications | 52,038 | 8,416 | 8,416 |
| Information | 2,000 | 755 | 755 |
| Professional and special services | 514,156 | 55,380 | 55,380 |
| Rentals | 6,240 | 1,522 | 1,522 |
| Repair and maintenance | 51,623 | 4,817 | 4,817 |
| Utilities, materials and supplies | 25,275 | 3,292 | 3,292 |
| Acquisition of land, buildings and works | 26,361 | 607 | 607 |
| Acquisition of machinery and equipment | 50,580 | 4,977 | 4,977 |
| Transfer payments | 0 | 0 | 0 |
| Other subsidies and payments | 11,629 | 6,488 | 6,488 |
| Total gross budgetary expenditure | 2,368,116 | 528,001 | 528,001 |
| Less revenues netted against expenditures | |||
| Sales of services | 24,030 | 3,587 | 3,587 |
| Other revenue | 0 | -3 | -3 |
| Total revenues netted against expenditures | 24,030 | 3,584 | 3,584 |
| Total net budgetary expenditures | 2,344,086 | 524,417 | 524,417 |
- Date modified: