Canada Border Services Agency
2019 to 2020 Departmental Results Report
Complete a survey on your experience using this Departmental Results Report.
Table of contents
- Minister's message
- Results at a glance and operating context
- Results: what we achieved
- Analysis of trends in spending and human resources
- Additional information
- Appendix: definitions
Minister's message

As Minister of Public Safety and Emergency Preparedness, I am pleased to present to Parliament the Canada Border Services Agency's (CBSA) Departmental Results Report for the 2019 to 2020 fiscal year.
As set out in the CBSA's mandate, the Agency provides integrated border services that support national security and public safety priorities, while facilitating the free flow of legitimate trade and travel. The Agency is committed to protecting the safety and security of Canadians, as well as the stability and prosperity of our economy.
Although the 2019 to 2020 fiscal year began in a similar way to many other years, it ended very differently than any we have seen before. The novel coronavirus was first reported in December 2019 and started to have a profound effect across the world during the final quarter of 2019 to 2020. The COVID-19 pandemic has had an unprecedented impact on the daily lives of Canadians and has prompted a whole-of-government response on multiple fronts that will continue into 2020 to 2021.
The CBSA has played a vital role in Canada's earliest efforts to mitigate the impact of COVID-19 on our people and economy, including implementing travel restrictions, border measures and screening requirements. The Agency has mobilized resources and worked closely with federal partners to facilitate essential trade and travel in order to maintain critical supply chains and help Canadians abroad to return home, while limiting further introduction and transmission of the virus.
In addition to supporting the Government's COVID-19 response, the Agency supported many other Government priorities in 2019 to 2020 and continued to advance its transformation agenda. Beginning in 2019 to 2020 and continuing over the next five years, the Government is investing over $1 billion to enhance the integrity of Canada's borders and asylum system through the Border Enforcement Strategy, which will increase asylum processing capacity, provide timely protection to refugees, and ensure the expeditious removal of failed asylum claimants. As part of ongoing Indigenous reconciliation efforts, the Agency launched a Border Collaboration Initiative through Nation-to-Nation engagement with the Mohawks of Akwesasne First Nation to improve the border experience.
The CBSA also continued to leverage its relationship with the United States to enhance the security of our shared border through several key achievements in 2019 to 2020. These include the coming into force of Bill C-21 that provides authorities for implementation of the Entry/Exit initiative, as well as the ratification of the Agreement on Land, Rail, Marine and Air Transport Preclearance that expands abilities for preclearance operations across all modes of cross-border trade and travel. The CBSA was also instrumental in reinforcing Canada's strong economic ties with the United States and Mexico, leading to the ratification of the new Canada–United States–Mexico Agreement.
The CBSA continued to modernize its processes and technologies in 2019 to 2020, including the introduction of enhanced biometric technology for processing of NEXUS members at Canadian airports, as well as the ongoing pilot of the Secure Corridor Concept for expedited border processing of trusted traders. The Agency also continued to enhance detection and interdiction capabilities for illicit drugs, firearms and contaminated goods, including the deployment of additional detector dog teams, the operationalization of designated safe examination areas, and the opening of a state-of-the-art facility for marine container examinations. Finally, the Agency continued to advance the development of a comprehensive strategy to manage continually increasing volumes of e-commerce.
In closing, I want to assure all Canadians that the CBSA remains steadfast in protecting the health, safety and security of our communities, and I encourage all Canadians to stay strong during this challenging time.
The Honourable William Sterling Blair, P.C., C.O.M., M.P.
Minister of Public Safety and Emergency Preparedness
Results at a glance and operating context
Operating context
The CBSA operates in a complex and dynamic environment where it must respond to emerging risks and global economic trends, while remaining steadfast and vigilant in its commitment to protect the security of Canada's people, economy and infrastructure. As such, the CBSA constantly strives to be proactive in responding to evolving threats, adaptive to shifting trends, innovative in its use of technology, and agile in mobilizing its resources to ensure the integrity of our borders.
Toward the end of 2019 to 2020 and continuing into the current fiscal year, the unique challenges posed by the COVID-19 pandemic have highlighted the crucial importance of the CBSA's role in protecting national security and public safety. Since the official declaration of the pandemic in Canada in , the Agency has been working tirelessly at the forefront of the Government's COVID-19 response, including joint efforts with federal partners and US counterparts to rapidly implement border restrictions and enhanced screening measures, facilitate repatriation flights, and collect traveller contact information upon entry into Canada to support quarantine requirements. Concurrently, the Agency has been working with other government departments to put a range of measures in place to keep the border open for commerce and trade in support of Canada's economy.
Through these efforts, the CBSA has taken significant steps in reducing the potential for viral spread, while protecting critical supply chains and ensuring the continued availability of essential goods and services. The Agency has mobilized its regional workforce by deploying border services officers (BSOs) from traveller operations to commercial processing in order to support the continued movement of goods in all modes, thereby reducing the economic impact of the virus by minimizing disruption to cross-border trade. Throughout this period, the Agency has been working closely with portfolio and health partners to implement precautions at the frontline to ensure the safety of its workforce as well as the public.
From a border processing perspective, traveller volumes and irregular migration decreased in 2019 to 2020 (by approximately 2% and 13% respectively in comparison to 2018 to 2019), which is mainly attributable to the onset of COVID-19 toward the end of the fiscal year; however, disruption to trade supply chains and rising e-commerce volumes have continued to place demands on the Agency's resources, and further demands are expected going forward given the heightened prevalence of online shopping in the COVID-19 environment.
Meanwhile, the cross-border threats posed by illicit substances, firearms and counterfeit or contaminated goods continue to be key operational priorities for the CBSA, particularly in the contexts of the opioid crisis, the rise of gun and gang violence, and the risk of African swine fever being introduced into Canada. The Agency continues to actively combat these threats through enhanced targeting and detection capabilities as well as close collaboration with law enforcement partners.
The Agency's programs and operations also directly contribute to the health and competitiveness of the Canadian economy. As our country moves towards recovery from the economic circumstances surrounding the COVID-19 pandemic, the Agency's role in protecting Canadian industry from unfair trade practices will remain vital to our national prosperity, as will its role in facilitating the flow of legitimate trade into and out of Canada.
Finally, in light of this increasingly complex operating environment, the CBSA's ongoing efforts to improve its organizational health, modernize its business, and ensure the sustainability of its operations and infrastructure will continue to stand the Agency in good stead to meet the demands of the future.
Results at a glance
The highlights below provide an overview of key results achieved in 2019 to 2020:
Border management
- Continued to identify and interdict threats through effective risk assessment, resulting in 2,242 high-risk individuals being denied entry to Canada at ports of entry
- Combatted the smuggling of illicit drugs, resulting in 29,247 drug seizures with a total value of $519.3 million, through efforts such as the operationalization of designated safe examination areas and the continued deployment of detector dogs at postal facilities
- Combatted the smuggling of firearms and prohibited weapons, resulting in 19,719 seizures
- Continued ongoing efforts with the Canadian Food Inspection Agency (CFIA) to safeguard the Canadian pork industry from African swine fever, including promoting traveller awareness and issuing 2,071 penalties for failure to declare food, plant and animal products
- Facilitated the entry of admissible travellers through the continued introduction of automated fingerprint verification in Primary Inspection Kiosks (PIK), with eight of Canada's major airports equipped as of
- Continued to process travellers efficiently in the highway mode, meeting service standards for border wait times 96% of the time for regular travellers and 98.3% of the time for NEXUS travellers
- Ratified the Agreement on Land, Rail, Marine and Air Transport Preclearance (LRMA) between Canada and the United States (US), and successfully transitioned US preclearance operations at Canadian airports to the new legal framework
- Advanced the implementation of the CBSA Assessment and Revenue Management (CARM) project, including a finalized design of the end-state CARM solution
- Guarded against unfair trade practices through the administration of trade and anti-dumping programs, helping to protect approximately 31,000 Canadian jobs and $12 billion worth of domestically produced goods in the Canadian marketplace
- Strengthened commercial examination capacity by opening a new, state-of-the-art facility for marine container examinations in Tsawwassen, British Columbia
- Initiated the deployment of modernized kiosks at NEXUS airports, leveraging biometric technology for streamlined processing of trusted travellers
- Continued the pilot of the Secure Corridor Concept for streamlined processing of trusted traders at the Ambassador Bridge port of entry, achieving consistently faster passages in the Secure Corridor lane than in regular commercial lanes
- Advanced the Agency's 30-year Real Property Investment Strategy, including $440 million of repurposed funding secured in Budget 2019 for the renewal of up to 24 ports of entry through the Land Border Crossing Project
- Launched a Border Collaboration Initiative with the Mohawks of Akwesasne First Nation to improve the border crossing experience at the Cornwall port of entry
Border enforcement
- Secured over $326 million in incremental funding approved under Budget 2019 to enhance border integrity and address pressures facing the in-Canada asylum system
- Initiated joint efforts on an Asylum Interoperability Project with Immigration, Refugees and Citizenship Canada (IRCC) and the Immigration and Refugee Board (IRB) to streamline the processing of in-Canada asylum claims
- Advanced the construction or retrofitting of three Immigration Holding Centres (IHC) and continued the expansion of the Alternatives to Detention Program, supporting ongoing efforts to improve the national immigration detention system
- Enforced the removal of 11,313 inadmissible persons, which represents an increase of nearly 17% compared to last fiscal year
- Led an international engagement strategy in collaboration with federal partners to address challenges in obtaining the required travel documents to remove persons from Canada
Internal services
- Launched a comprehensive Respectful Workplace Strategy, encompassing a renewed Mental Health Strategy, including efforts to support the wellbeing of employees at all levels, as well as initiatives to prevent and respond to harassment
- Developed an Employment Equity, Diversity and Inclusion (EEDI) Plan to continue fostering diversity and inclusion throughout the Agency
- Conducted a nationwide engagement tour to gather employee feedback and identify opportunities for improvement of the Agency's culture in order to ensure a healthy and productive work environment
- Advanced the Agency's five-year Sustainability and Modernization Plan, including the implementation of a new Functional Management Model to improve alignment and accountability across the Agency, as well as the nationalization of internal services to improve consistency and efficiency across all regions, with significant progress on key professional services for human resources, communications, real property and security functions
- Implemented an Agency-wide integrated business planning process and improved the Agency's financial governance practices, supporting more effective management of the Agency's programs, projects and resources
- Implemented enhancements to the Agency's information technology (IT) infrastructure and capacity
For more information on the CBSA's plans, priorities and results achieved, see the Results: what we achieved section of this report.
CBSA services at a glance
The CBSA processed millions of travellers and shipments in 2019 to 2020 and provided services at multiple points across Canada and abroad, including the following:
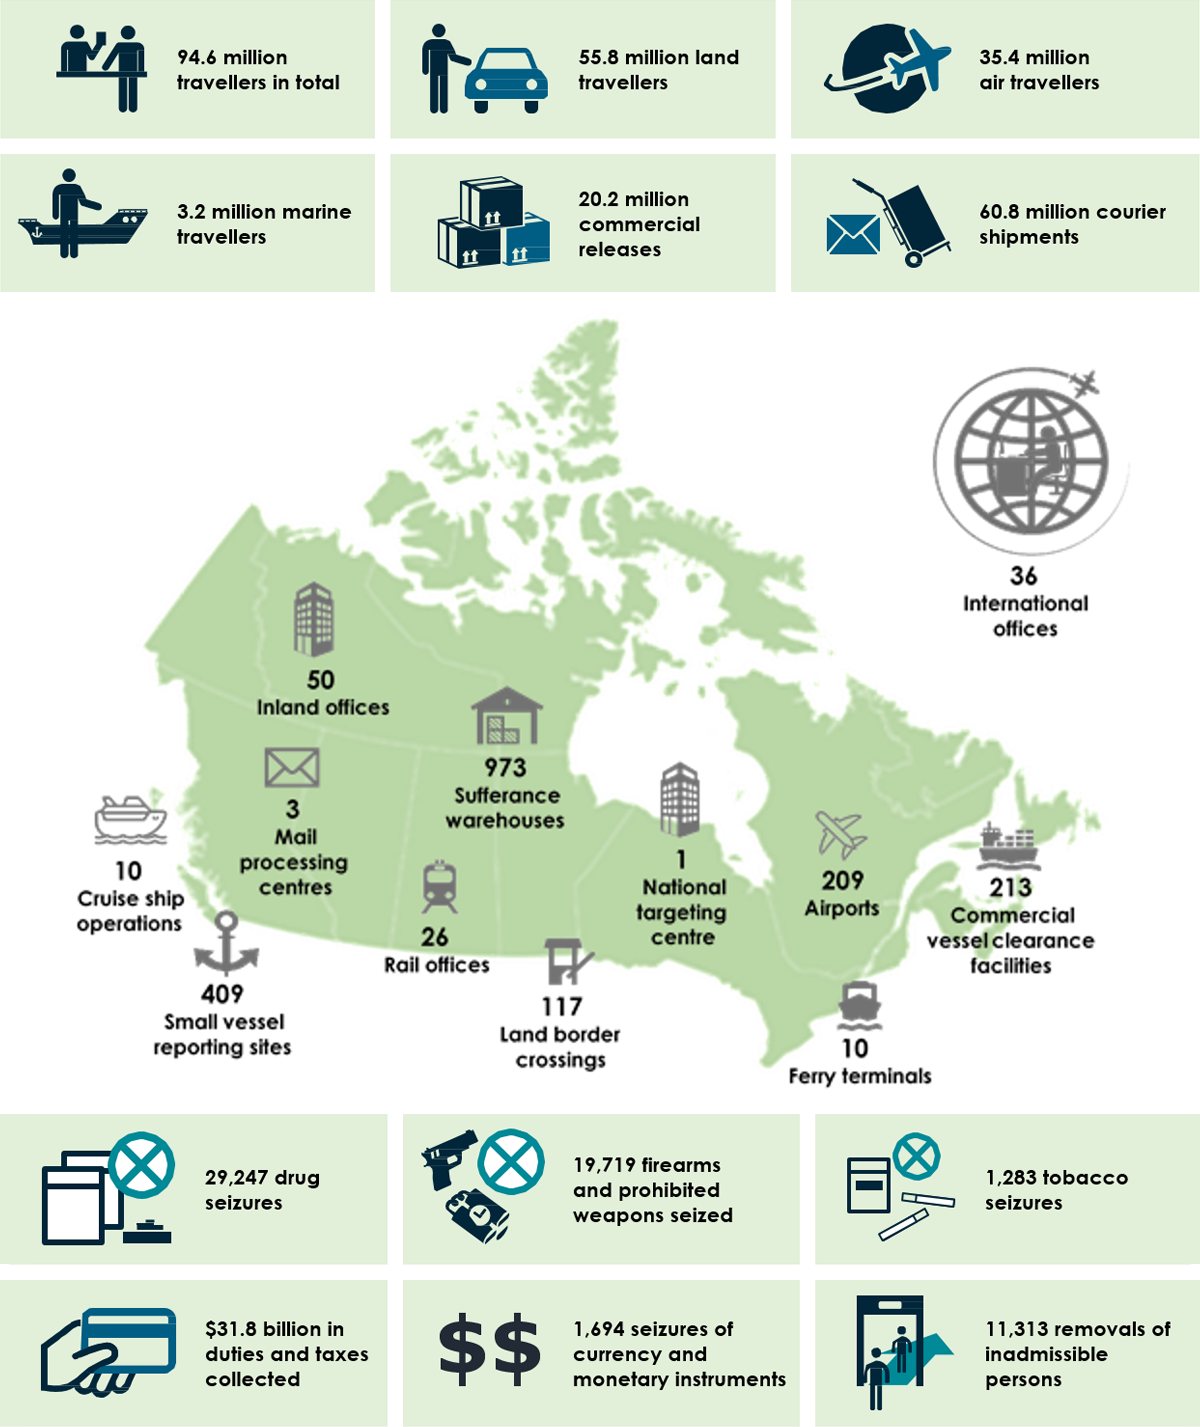
Image description
Volumes
- 94.6 million travellers in total
- 55.8 million land travellers
- 35.4 million air travellers
- 3.2 million marine travellers
- 20.2 million commercial releases
- 60.8 million courier shipments
- 29,247 drug seizures
- 19,719 firearms and prohibited weapons seized
- 1,283 tobacco seizures
- $31.8 billion in duties and taxes collected
- 1,694 seizures of currency and monetary instruments
- 11,313 removals of inadmissible persons
Locations
- 36 international offices
- 10 cruise ship operations
- 409 small vessel reporting sites
- 3 mail processing centres
- 50 inland offices
- 26 rail offices
- 973 sufferance warehouses
- 117 land border crossings
- 1 national targeting centre
- 209 airports
- 10 ferry terminals
- 213 commercial vessel clearance facilities
Results: what we achieved
Border management
Description
The CBSA assesses risk to identify threats, manages the free flow of admissible travellers and commercial goods into, through and out of Canada, and manages non-compliance.
Results
In 2019 to 2020, the CBSA spent $1.4 billion and employed 10,455 full-time equivalents to continue delivering results under its core responsibility of Border Management, including the following:
-
The CBSA's intelligence, threat and risk assessment activities support CBSA programs in the identification and interception of high-risk people, goods and conveyances that pose a threat to the security of Canadians
Together with national security partners including IRCC and the Canadian Security Intelligence Service, the CBSA continued to optimize security screening processes. Specifically, the Agency enhanced its Quality Assurance Framework for national security screening and increased capacity for case processing through the Inventory Reduction and Transformation Action Plan, successfully reducing the number of cases awaiting security screening to its lowest level in over five years by the end of 2019 to 2020. Throughout 2019 to 2020, the Agency consistently met IRB timelines for refugee protection hearings, with 0% of IRB hearing delays occurring due to delayed security screening results on a national level.
In response to the opioid crisis, the CBSA continued to combat opioid smuggling through the identification and interdiction of illicit drugs, and implemented operations at 40 Designated Safe Examination Areas as of . The CBSA continued to improve controls to stem the flow of illicit drugs through the postal stream and, in collaboration with Canada Post, initiated the construction of Designated Safe Sampling Areas at the mail processing centres in Montréal and Toronto. Also, through the deployment of detector dog teams at postal facilities, approximately 1,885 searches were conducted and nearly 28% of those searches were resultant for narcotics or firearms.
In maintaining vigilance against the threat of African swine fever, the Agency successfully secured funding in Budget 2019 for 24 additional detector dog teams to be strategically deployed at ports of entry across Canada. The Agency also continued ongoing efforts with the CFIA to safeguard the Canadian pork industry from African swine fever, including a public awareness campaign aimed at travellers and stakeholders in Canada and overseas. As part of these efforts, the CBSA issued 2,071 Agriculture and Agri-Food Administrative Monetary Penalties against individuals who failed to declare food, plant and animal products in 2019 to 2020.
In furtherance of ongoing efforts to finalize the Passenger Name Record (PNR) agreement between Canada and the European Union (EU), the CBSA continues to work towards a conclusion to ensure that commercial air carriers based in the EU continue to provide PNR data to the CBSA for risk assessment purposes.
Identifying and interdicting threats through effective risk assessment
In 2019 to 2020, risk assessment activities conducted by the CBSA resulted in:
- 2,242 resultant immigration targets whereby an individual was denied entry to Canada at ports of entry;
- disruption of travel to Canada of 103 foreign nationals, 8 of whom were suspected members of organized crime groups;
- prevention of the boarding on flights destined for Canada of 162 persons subject to an enforced removal order.
-
Admissible travellers are processed in an efficient manner
To enhance the CBSA's capacity for traveller processing in the air mode, the Agency continued the introduction of automated fingerprint verification through PIK, with eight of Canada's major airports equipped as of . This functionality represents a major step forward in the Agency's use of biometrics to confirm the identity and facilitate the entry of admissible travellers in a secure and efficient manner.
In 2019 to 2020, the CBSA collaborated with the air industry on plans to integrate a streamlined International to Domestic baggage process as part of regular air traveller processing at major airports. For eligible travellers who are arriving internationally and transferring domestically, this innovative and facilitative process allows their baggage to be transferred directly to their final destination (except in circumstances where a secondary examination is warranted), thereby simplifying the connection process for the majority of connecting travellers.
-
Travellers and their goods are compliant with applicable legislation
The LRMA came into force in , representing a major milestone in the security of Canada's shared border with the US. The CBSA successfully transitioned US preclearance operations at Canadian airports to the new legal framework by training US preclearance officers ahead of the LRMA's coming into force and by ensuring that the Agency was well positioned to respond to US requests for assistance related to inadmissible travellers and goods. The CBSA also initiated joint plans for a land border preclearance pilot to inform the potential development of future Canadian preclearance operations in the US.
In 2019 to 2020, the CBSA continued to monitor the cross-border movement of cannabis, which remains a criminal offence in Canada, and observed an increase in voluntary forfeitures of cannabis by travellers as well as an increase in the importation interdiction rate in the postal and courier streams. Throughout the fiscal year, the CBSA laboratory analyzed 26.5% of the suspected cannabis samples received from ports of entry within 30 days and this percentage is expected to increase over the next fiscal year through the continual refinement of testing and analysis methods.
As part of a broad public awareness campaign to mitigate the risk of travellers unintentionally violating cannabis laws, the CBSA issued messaging via its website and social media to inform travellers of the prohibition against transporting cannabis across international borders without a valid permit or exemption issued by Health Canada. Additionally, the Agency continued to develop policies and procedures related to the new Administrative Monetary Penalty regime for cannabis-related contraventions of the Customs Act by travellers.
To ensure continued vigilance in detecting signs of impaired driving at ports of entry, the Agency implemented standardized screening tools and delivered related training to approximately 716 BSOs by the end of 2019 to 2020, with an additional 709 BSOs planned for 2020 to 2021, which will cumulatively account for nearly one third of all BSOs based at land border crossings.
-
Admissible commercial goods and conveyances are processed (including the collection of revenues) in an efficient manner
The CBSA developed requirements for implementation of rail and air courier proof of concept operations, which will inform the potential future expansion of Canadian cargo preclearance operations in the US. The goal of these operations is to streamline processes and facilitate the cross-border flow of legitimate goods, while providing an opportunity to target and interdict high-risk goods earlier in the supply chain.
The CBSA advanced the development of its E-Commerce Customs Strategy to manage the dramatic increase in e-commerce volumes of casual importations. Specifically, the Agency completed preparatory work for proofs of concept to enhance the Agency's risk assessment capabilities to detect high-risk shipments in the courier mode, while also piloting analytical tools to improve risk-based compliance. Additionally, the Agency led the development and gained working group endorsement of the World Customs Organization's Framework of Standards on Cross-Border E-Commerce, which establishes international standards for ensuring a safe, secure and sustainable e-commerce environment.
-
Trade partners are compliant with applicable legislation, requirements and measures
In 2019 to 2020, the Agency advanced the implementation of the CARM project by finalizing the design of the end-state CARM solution as well as completing the build configuration and final testing of the first CARM release, which will modernize the Agency's revenue management systems and provide external clients with foundational self-serve options (e.g., the ability to view their account information online) through the introduction of a portal. Once fully implemented in 2022, CARM will help address the Agency's risk of inaccurately assessing duties and taxes owing on imported goods, while deterring wilful non-compliance with Canada's trade requirements, by automating the processes required to assess, collect, manage and report on revenue.
To strengthen its commercial examination capacity, the CBSA opened the Tsawwassen Marine Container Examination Facility in . The opening of this facility is the culmination of substantial collaborations between the CBSA, the Vancouver Fraser Port Authority and the Tsawwassen First Nation, enabling streamlined border processing and increased border security through state-of-the-art examination technology.
The Agency continued to protect Canadian industry from unfair trade practices through administration of the Special Import Measures Act (SIMA), including increased capacity for Anti-Dumping and Countervailing investigations and duty enforcement. Additionally, the CBSA administered trade requirements arising from free trade agreements in support of Canada's trade agenda.
Guarding against unfair trade practices
In 2019 to 2020, the CBSA assessed over $112.2 million in SIMA duties, with 119 SIMA measures in force (including those on steel, copper, aluminum, food and agricultural products, construction materials, and consumer goods), resulting in the protection of approximately 31,000 Canadian jobs and $12 billion in Canadian production.
-
Trusted Traveller and Trader programs increase processing efficiency of low-risk, pre-approved travellers and trade partners
In 2019 to 2020, the CBSA delivered enhanced services for trusted travellers in the air mode through the replacement of legacy kiosks at NEXUS airports with modernized kiosks that use facial biometric verification. The initial deployment of modernized NEXUS kiosks took place at Vancouver International Airport in , with additional airports transitioned to the new kiosks through the remainder of 2019 to 2020. Deployment of the modernized kiosks is planned for two additional airports in 2020 to 2021.
Additionally, to enhance services for trusted travellers in the land mode, the Agency began the installation of NEXUS eGate lanes at the Ambassador Bridge port of entry and is considering future expansion to additional sites once technical issues are resolved and funding is secured. The NEXUS eGate initiative allows NEXUS members to be remotely processed by BSOs inside the port of entry office through the use of various technologies such as radio-frequency identification, closed-circuit television and voice over internet protocol.
Building upon the expedited processing that members of the CBSA's Trusted Trader programs currently receive, the Agency continued the pilot of the Secure Corridor Concept for low-risk, pre-approved traders at the Ambassador Bridge port of entry. This pilot is helping to advance the transformation of the Agency's pre-existing model for border crossing as it eliminates manual processes, minimizes human interaction, and introduces remote processing through innovative technologies. The pilot has demonstrated successful results so far, with consistently faster passages in the Secure Corridor lane representing less than one quarter of the processing time required in a regular commercial lane. The duration of the pilot has been extended through to the end of 2020 to 2021 and a proposal has been developed to roll out further Secure Corridor lanes once funding has been approved.
In continuing to develop relationships with international partners to improve service delivery for trusted traders, the Agency signed Mutual Recognition Arrangements with Hong Kong and New Zealand in , bringing the Agency's total number of MRAs up to nine.
-
Travellers and the business community have access to timely redress mechanisms
Through the CBSA's Recourse Program, travellers and businesses are provided with an accessible mechanism to seek an impartial review of CBSA decisions, as well as to voice any feedback or complaints, in accordance with policies and legislation administered by the Agency. In 2019 to 2020, the Agency advanced its action plan to improve the efficiency and effectiveness of service delivery in the Recourse Program, including:
- Improving information management by leveraging available technologies such as GCcase to replace the Recourse Content Management System
- Publishing Recourse statistics on the Agency's website such as appeal results and average processing times, such as 85% of trade appeals being decided within service standards
-
Additional border management initiatives
The Agency continued to strengthen its frontline workforce through its Force Generation Program which consolidates the recruitment, training and development of BSOs and officer trainees. Through the Force Generation Program, targeted recruitment strategies were developed in support of Employment Equity objectives and 368 officer trainees were delivered to the frontline in 2019 to 2020. The Agency also expanded its National Training Standards to guide workforce development, further ensuring that the right people are in the right place with the right skills.
In collaboration with the Windsor-Detroit Bridge Authority, the Agency advanced the Gordie Howe International Bridge project by further developing the statement of requirements to reflect updated infrastructure and resourcing needs. Additionally, the Agency advanced its 30-year Real Property Investment Strategy by finalizing a three-year plan to ensure the safety, security and sustainability of CBSA facilities, as well as securing funding in Budget 2019 to renew and modernize up to 24 ports of entry over the next five to seven years through the Land Border Crossing Project.
The Agency continued to mature its vision and strategy for enterprise data analytics by expanding its data governance functions, developing analytical tools and techniques, integrating business intelligence functions with analytics, and promoting data fluency at all levels throughout the Agency.
Finally, the Agency continued to collaborate with participating government departments as well as the private sector to advance the implementation of the Single Window Initiative and to assist trade chain partners in transitioning to the new Integrated Import Declaration service.
-
Reconciliation in border management
In line with the CBSA's Indigenous Framework and Strategy, the Agency implemented specialized training for BSOs on the processing of Indigenous travellers. To provide BSOs with enhanced guidance on the processing of Indigenous travellers and their goods, the Agency has undertaken an extensive review of internal policies and processes in order to reflect considerations unique to First Nations, Métis and Inuit people who are transiting the border. The Agency also staffed additional Regional Indigenous Affairs Advisor positions across the country in order to provide dedicated regional capacity and capability to address local Indigenous matters and to develop strong relationships with First Nations, Métis and Inuit communities.
Further supporting Indigenous reconciliation efforts, the Agency led the Nation-to-Nation engagement on behalf of the Crown with the Mohawks of Akwesasne First Nation, which resulted in the joint launch of a Border Collaboration Initiative to improve the border crossing experience at the Cornwall port of entry. This initiative includes short-term improvements such as enhancing service capacity at the port of entry, along with medium- and long-term improvements such as exploring options to improve processing for domestic travellers and to support the economic development goals of the Mohawks of Akwesasne First Nation.
Finally, to promote greater awareness of Indigenous history, the CBSA commemorated Orange Shirt Day in September 2019 at all levels and across all regions. For the first time, BSOs were able to wear Orange Shirt pins on their uniforms, which were noticed and appreciated by many Indigenous travellers.
Gender-based analysis plus
In 2019 to 2020, the CBSA continued to refine its internal GBA+ governance and data collection practices, applying the GBA+ lens where feasible to inform policy and program decisions impacting service delivery. The Agency also continued to implement the Government's Policy Direction to Modernize the Government of Canada's Sex and Gender Information Practices and undertook internal consultations to identify areas most impacted by the policy.
Additionally, the CBSA achieved GBA+ results in the following areas:
- The Agency created an internal GBA+ Working Group and undertook the development of a multi-year action plan to address GBA+ in its Officer Induction Model.
- The Agency continued to utilize a focused recruitment approach in order to reduce barriers and diversify the pool of candidates by capitalizing on opportunities to participate in recruitment events tailored toward historically underrepresented groups such as young women in the fields of public safety and law enforcement.
- The Agency staffed additional Regional Indigenous Affairs Advisor positions across the country to support regional recruitment efforts by providing local insights and guidance on Indigenous considerations.
- The Agency continued to apply GBA+ considerations in the design of training materials for employees, and continued to review policies, procedures and communications to ensure the use of inclusive language.
Experimentation
In 2019 to 2020, the CBSA pursued solutions involving innovation and experimentation in the following areas under its core responsibility of Border Management:
Secure Corridor
The Agency continues to pilot the Secure Corridor Concept for low-risk, pre-approved traders at the Ambassador Bridge port of entry. This pilot is helping to advance the transformation of the Agency's pre-existing model for border crossing as it eliminates manual processes, minimizes human interaction, and introduces remote processing through innovative technologies. The pilot has demonstrated successful results so far, with consistently faster passages in the Secure Corridor lane representing less than one quarter of the processing time required in a regular commercial lane, and the duration of the pilot has been extended through to the end of 2020 to 2021.
NEXUS eGate
To enhance services for trusted travellers in the land mode, the Agency began the installation of NEXUS eGate lanes at the Ambassador Bridge port of entry and is considering future expansion to additional sites once technical issues are resolved. The NEXUS eGate initiative allows NEXUS members to be remotely processed by BSOs inside the port of entry office through the use of various technologies such as radio frequency identification, closed-circuit television and voice over internet protocol.
International to Domestic Baggage Process
The Agency collaborated with the air industry on plans to integrate a streamlined International to Domestic baggage process as part of regular air traveller processing at major airports. For eligible travellers who are arriving internationally and transferring domestically, this innovative and facilitative process allows their baggage to be transferred directly to their final destination (except in circumstances where a secondary examination is warranted), thereby simplifying the connection process for the majority of connecting travellers.
Enhancing Commercial Risk Assessment
Due to the constantly increasing volumes of importations and complexity of transactions associated with e-commerce, the CBSA is modernizing the way it delivers on its mandate. In the commercial stream, the Agency has focused on harnessing the power of data analytics and artificial intelligence to streamline and enhance its risk assessment capability, including experiments with blockchain, algorithms and machine-learning to build the Agency's ability to target and intercept contraband such as guns and opioids. Results from these small-scale experiments and development of prototypes are positive and will inform future program-level improvements to streamline processes and facilitate the importation of legitimate goods.
Project Quantum
The Agency initiated Project Quantum, which was strategically designed to address the issue of irregular migration at the earliest possible point in the air travel continuum. By leveraging data collected through the Interactive Advance Passenger Information initiative and employing advanced data analytics to create predictive streams, the Agency is now able to develop pre-departure threat identification models in order to identify and intercept high-risk travellers up to 24 hours prior to departure.
Innovative Solutions Canada Program
Through the Innovative Solutions Canada Program, which is administered by Innovation, Science and Economic Development Canada, the Agency engaged with Canadian industry and pursued experiments in the following areas:
- Enhance tools for detection and handling of hazardous substances at the border
- Improve the transit of small packages in postal operations
- Improve information management processes through automated redaction of protected information in video recordings to facilitate access to information requests
- Support the delivery of the CARM project by testing a solution to automate manual paper processes
Results achieved for Border Management
As shown in the table below, the CBSA has a total of 23 performance indicators under Border Management, of which only four have results that missed the associated target and only one has an unavailable result due to the indicator being replaced.
| Performance indicators | Target | Date to achieve target | 2017 to 2018 actual results | 2018 to 2019 actual results | 2019 to 2020 actual results |
|---|---|---|---|---|---|
| Percentage of threats identified that lead to an enforcement action or inadmissibility recommendation | At least 18% | 3% | N/AFootnote 1 | N/AFootnote 1 | |
| Ratio of the value of intelligence-led seizures to the value of non-intelligence led seizures | At least 20:1 | 35:1 | 20:1 | 26:1 |
| Performance indicators | Target | Date to achieve target | 2017 to 2018 actual results | 2018 to 2019 actual results | 2019 to 2020 actual results |
|---|---|---|---|---|---|
| Percentage of time the CBSA is meeting the Highway Border Wait Times (BWT) Service Standard | At least 95% | 98.2% | 96.1% | 96.0% | |
| Percentage of travellers using Primary Inspection Kiosks (PIK) at PIK-enabled airports | At least 95% | N/A (indicator was not in place) | N/A (indicator was not in place) | 93.2%Footnote 2 | |
| Actual availability of Primary Inspection Kiosks as a percentage of planned availability | At least 99% | N/A (indicator was not in place) | N/A (indicator was not in place) | 98.0%Footnote 3 |
| Performance indicators | Target | Date to achieve target | 2017 to 2018 actual results | 2018 to 2019 actual results | 2019 to 2020 actual results |
|---|---|---|---|---|---|
| Percentage of traveller examinations that produced a result (enforcement or facilitation action) | At least 31% | 30.7% | 44.5% | 54.2% | |
| Percentage of traveller goods examinations that produced a result (enforcement or facilitation action) | At least 20% | 18.2% | 22.3% | 25.9% |
| Performance indicators | Target | Date to achieve target | 2017 to 2018 actual results | 2018 to 2019 actual results | 2019 to 2020 actual results |
|---|---|---|---|---|---|
| Percentage of time the CBSA met the commercial Highway Border Wait Time Service Standard | At least 90% | N/A (indicator was not in place) | N/A (indicator was not in place) | 99.7% | |
| Percentage of eligible release decisions provided within established timeframes | At least 70% | N/A (indicator was not in place) | N/A (indicator was not in place) | 63%Footnote 4 | |
| Actual availability of Single Windows as a percentage of planned availability | At least 99% | N/A (indicator was not in place) | N/A (indicator was not in place) | 99.9% |
| Performance indicators | Target | Date to achieve target | 2017 to 2018 actual results | 2018 to 2019 actual results | 2019 to 2020 actual results |
|---|---|---|---|---|---|
| Percentage of random commercial examinations that produced a result | At most 1% | 0.26% | 0.33% | 0.23% | |
| Percentage of high-risk commercial goods targeted by the National Targeting Center that are examined at the border | At least 95% | 96.2% | 96.7% | 95.2% | |
| Percentage of commercial examinations that produced a result against a trader | At most 1.5% | 1.38% | 1.27% | 1.43% | |
| Percentage of penalties applied against traders representing continued non-compliance | At most 70% | 59% | 59% | 35% | |
| Return on investment (ROI) for targeted verifications | At least 8:1 | 17:1 | 20:1 | 11:1 | |
| Percentage of revenue-based targeted trade compliance verifications that yielded a result | At least 60% | 44% | 53% | 56%Footnote 5 | |
| Percentage of imports potentially subject to anti-dumping or countervailing duties verified to ensure compliance | At least 80% of the value for duty of potentially subject goods | 85% | 82% | 89% |
| Performance indicators | Target | Date to achieve target | 2017 to 2018 actual results | 2018 to 2019 actual results | 2019 to 2020 actual results |
|---|---|---|---|---|---|
| Percentage of time the CBSA is meeting the NEXUS Highway BWT Service Standard | At least 95% | N/A (indicator was not in place) | N/A (indicator was not in place) | 98.3% | |
| Ratio of Trusted Travellers referred for examination compared to conventional travellers | At most 1:5 | 1:4 | 1:12 | 1:11 | |
| Percentage of Trusted Travellers in compliance with legislation and program regulations | At least 95% | 99.89% | 99.88% | 99.9% | |
| Ratio of conventional traders and their goods that are examined at the border compared to Trusted Traders and their goods | At least 2.5:1 | 4.6:1 | 6.9:1 | 5.9:1 | |
| Percentage of trade by value of goods imported into Canada by participants in CBSA's Trusted Trader programs | At least 25% | 27% | 26% | 28% |
| Performance indicators | Target | Date to achieve target | 2017 to 2018 actual results | 2018 to 2019 actual results | 2019 to 2020 actual results |
|---|---|---|---|---|---|
| Percentage of trade appeals received that are decided within established service standards | At least 70% | 46% | 80% | 85% | |
| Percentage of enforcement appeals received that are decided within established service standards | At least 70% | 80% | 75% | 71% |
| Main estimates | 1,282,523,110 |
|---|---|
| Planned spendingFootnote 6 | 1,282,523,110 |
| Total authorities available for use | 1,696,498,075 |
| Actual spending (authorities used) | 1,436,288,374 |
| Difference (actual spending minus planned spending)Footnote 7 | 153,765,264 |
| Planned full-time equivalents | 10,551 |
|---|---|
| Actual full-time equivalents | 10,455 |
| Difference (actual full-time equivalents minus planned full-time equivalents) | (96) |
Border enforcement
Description
The CBSA contributes to Canada's security by supporting the immigration and refugee system when determining a person's admissibility to Canada, taking the appropriate immigration enforcement actions when necessary, and supporting the prosecution of persons who violate our laws.
Results
In 2019 to 2020, the CBSA spent $244.3 million and employed 1,665 full-time equivalents to continue delivering results under its core responsibility of Border Enforcement, including the following:
-
Immigration investigations identify persons inadmissible to Canada
In response to pressures facing the in-Canada asylum system, the Agency successfully secured over $326 million in incremental funding approved under Budget 2019 to enhance border integrity, address increasing volumes of irregular migrants and asylum seekers, and undertake enforcement activities to facilitate the removal of persons found not to be in genuine need of Canada's protection.
The Agency continued to collaborate with the RCMP, IRCC, Public Safety Canada and the Public Health Agency of Canada to ensure operational coordination and readiness with regard to irregular migration, including contingency planning to increase processing capacity at high-volume locations across the country. The Agency also laid the groundwork for a joint CBSA-IRCC-IRB Asylum Interoperability Project to increase electronic data sharing and system efficiency related to the processing of in-Canada asylum claims. Additionally, the CBSA pursued the criminal investigation and prosecution of individuals who committed willful and serious immigration fraud, with a focus on organizers and facilitators.
Investigating and identifying inadmissible persons
In 2019 to 2020, the CBSA concluded 24,614 immigration investigations, with 69% of subjects identified as inadmissible to Canada.
-
CBSA detention decisions are risk-based and detention is used as a measure of last resort
In support of Canada's commitment to create a better and fairer immigration detention system, the CBSA continued to implement measures to improve the national immigration detention program through ongoing efforts under the National Immigration Detention Framework, in collaboration with federal and provincial government partners. Specifically, the Agency continued to support refinements and updates of national policy and operational guidance to ensure consistency regarding the documentation of detention decisions, the application of National Detention Standards, the management of IHC, and the consideration of the Best Interests of the Child.
In , two amendments were made to the Immigration and Refugee Protection Regulations in relation to immigration detention and the Best Interests of the Child. With these amendments, all decision-makers must consider the best interests of any child under 18 years of age who is directly affected by an immigration detention decision. Additionally, when a decision-maker is making a determination of a child's best interests in the context of immigration detention, the regulations prescribe a list of factors that must be considered.
In furtherance of ongoing efforts to improve detention facilities, the Agency completed construction and began operationalization of the new IHC in Surrey, British Columbia, completed the retrofit of the IHC in the Greater Toronto Area, and initiated construction of a new IHC in Laval, Quebec. The Agency also completed the drafting process for Memoranda of Understanding with the provinces of Alberta, Manitoba, Saskatchewan, New Brunswick and Prince Edward Island to standardize the care of immigration detainees in provincial correctional facilities, while also reducing reliance on provincial correctional facilities by initiating the transfer of enhanced-security detainees from provincial facilities to IHCs.
Through ongoing delivery and expansion of the Alternatives to Detention Program, the Agency continued to support consistent, risk-based detention decisions and enable the release of certain individuals into the community. In particular, the Agency extended its Electronic Monitoring pilot by an additional fiscal year, increased enrollment in the Voice Reporting Program, and expanded Community Case Management and Supervision services.
Expanding alternatives to detention
In 2019 to 2020, the CBSA released 2,611 individuals on alternatives to detention, which represents an increase of nearly 28% compared to last fiscal year.
-
CBSA admissibility recommendations and appeals are upheld at the Immigration and Refugee Board of Canada
The CBSA continued to work closely with the IRB to transform the detention review process and build upon the IRB Audit on Long-term Detention Reviews, including updates to the Agency's Enforcement Manual regarding admissibility hearings and detention review proceedings. The Agency also delivered a new Hearings Fundamentals Course to assist the development of the Minister's representatives in their role before the IRB.
-
Inadmissible persons subject to removal depart from Canada (i.e., escorted or unescorted)
To ensure the departure from Canada of inadmissible persons subject to removal, the CBSA continued to enhance its capacity to remove foreign national criminals, failed refugee claimants and other inadmissible persons through the implementation of a National Removal Strategy. Additionally, to address challenges in obtaining the required travel documents to remove persons from Canada, the CBSA led a whole-of-government international engagement strategy on recalcitrant countries in collaboration with federal partners including IRCC, Public Safety Canada and Global Affairs Canada. To this end, the Agency also led the development of several country-specific engagement plans to enhance Canada's bilateral relations with countries of interest in order to secure more timely issuance of travel documents needed to conduct removals.
Ensuring the removal of inadmissible persons
In 2019 to 2020, the CBSA enforced the removal of 11,313 inadmissible persons, which represents an increase of nearly 17% compared to last fiscal year.
-
People and businesses that are referred to Crown counsel for prosecution are convicted
The CBSA continued to build capacity to investigate and prosecute people and business entities that violate Canada's border-related legislation, with a focus on priority cases of fraud involving individuals and organizations posing a threat to Canada's immigration system and the Canadian economy.
Gender-based analysis plus
In 2019 to 2020, the CBSA continued to refine its internal GBA+ governance and data collection practices, applying the GBA+ lens where feasible to inform policy and program decisions impacting service delivery. The Agency also continued to implement the Government's Policy Direction to Modernize the Government of Canada's Sex and Gender Information Practices and undertook internal consultations to identify areas most impacted by the policy.
In line with the Government of Canada's commitment to support the full implementation of GBA+ across federal departments and agencies, the Agency continued to conduct GBA+ analyses on all immigration enforcement and inadmissibility policy proposals in order to help identify potential impacts on diverse groups based on multiple factors such as sex, gender, race, ethnicity, religion, age, and mental or physical disability.
Also in 2019 to 2020, the Government of Canada announced the National Strategy to Combat Human Trafficking, a horizontal initiative establishing a whole-of-government approach to combat human trafficking. As a proud partner of this effort, the Agency took preliminary steps to deliver on key commitments, particularly the commitment to assess immigration enforcement processes to ensure that sufficient protections are in place for victims of gender-based violence.
Experimentation
In 2019 to 2020, the Agency continued innovative approaches for implementation of its Alternatives to Detention Program, supporting risk-based detention decisions and enabling the release of certain individuals into the community. These include the ongoing implementation of the Electronic Monitoring Pilot, as well as ongoing exploration of biometric technologies to enhance the Voice Reporting Program.
Results achieved for Border Enforcement
As shown in the table below, the CBSA has a total of eight performance indicators under Border Enforcement, of which only one has a result that missed the associated target.
| Performance indicators | Target | Date to achieve target | 2017 to 2018 actual results | 2018 to 2019 actual results | 2019 to 2020 actual results |
|---|---|---|---|---|---|
| Percentage of immigration investigations concluded that result in a person being identified as inadmissible to Canada | At least 55% | 55% | 67% | 69% |
| Performance indicators | Target | Date to achieve target | 2017 to 2018 actual results | 2018 to 2019 actual results | 2019 to 2020 actual results |
|---|---|---|---|---|---|
| Percentage of persons subject to detention for immigration purposes enrolled into alternative to detention programs | At least 10% | N/A (indicator was not in place) | N/AFootnote 8 | 29.6% |
| Performance indicators | Target | Date to achieve target | 2017 to 2018 actual results | 2018 to 2019 actual results | 2019 to 2020 actual results |
|---|---|---|---|---|---|
| Percentage of inadmissibility referrals and appeals made to the Immigration and Refugee Board that result in an inadmissibility or ineligibility determination | At least 70% | N/A (indicator was not in place) | 74% | 74% | |
| Percentage of Ministerial interventions (at the Refugee Protection Division and the Refugee Appeals Division) and appeals that result in a negative refugee determination | At least 70% | N/A (indicator was not in place) | 72% | 75% |
| Performance indicators | Target | Date to achieve target | 2017 to 2018 actual results | 2018 to 2019 actual results | 2019 to 2020 actual results |
|---|---|---|---|---|---|
| Number of persons subject to removal who voluntarily comply with their departure order | At least 1,000 | N/A (indicator was not in place) | 2,023 | 2,151 | |
| Percentage of high-priority foreign nationals removed (i.e., on grounds of serious inadmissibility such as criminality, war crimes, security) | At least 80% | 69% | 79% | 93%Footnote 9 | |
| Median number of days to enforce a removal order from Canada | At most 365 days | N/A (indicator was not in place) | 146 days | 409 daysFootnote 10 |
| Performance indicators | Target | Date to achieve target | 2017 to 2018 actual results | 2018 to 2019 actual results | 2019 to 2020 actual results |
|---|---|---|---|---|---|
| Percentage of prosecutions concluded that result in a conviction | At least 80% | 84% | 92% | 90% |
| Main estimates | 206,693,897 |
|---|---|
| Planned spendingFootnote 11 | 206,693,897 |
| Total authorities available for use | 246,790,732 |
| Actual spending (authorities used) | 244,335,415 |
| Difference (actual spending minus planned spending)Footnote 12 | 37,641,518 |
| Planned full-time equivalents | 1,378 |
|---|---|
| Actual full-time equivalents | 1,665 |
| Difference (actual full-time equivalents minus planned full-time equivalents)Footnote 13 | 287 |
Internal services
Description
Internal Services are those groups of related activities and resources that the federal government considers to be services in support of programs and/or required to meet corporate obligations of an organization. Internal Services refers to the activities and resources of the 10 distinct service categories that support program delivery in the organization, regardless of the Internal Services delivery model in a department. The 10 service categories are:
- Acquisition Management Services
- Communication Services
- Financial Management Services
- Human Resources Management Services
- Information Management Services
- Information Technology Services
- Legal Services
- Material Management Services
- Management and Oversight Services
- Real Property Management Services
Results
Supporting a high-performing and innovative workforce
In 2019 to 2020, the CBSA launched its comprehensive Respectful Workplace Strategy, which encompasses its renewed Mental Health Strategy, including efforts to support the wellbeing of employees at all levels as well as initiatives to prevent and respond to harassment. The Agency also launched a Workplace Wellness Advisory Group to ensure a cohesive approach in implementing its Mental Health Strategy, along with a communication tool called the Mental Health Minute to provide employees with updates and resources on mental health and workplace wellbeing.
The CBSA continued to ensure that its workforce reflects Canada's diversity through the development of an EEDI Plan that expands the responsibility for meeting EEDI objectives beyond the Agency's human resources function and works in concert with other Agency-wide strategies, including the Outreach and Recruitment Strategy and the Official Languages Plan, to foster a culture of diversity and inclusion. The Agency achieved an 8% increase in the number of women appointed to executive positions in 2019 to 2020 compared to last fiscal year, including an increase in female representation among senior leadership roles in the Agency's regional management team. The Agency also implemented Indigenous Candidate Mentorship which is offered to all self-identified Indigenous candidates in the selection process for officer recruitment. Together, these efforts helped address enterprise risks around workforce planning and delivery by supporting the successful transition to the Agency's longer-term vision.
The CBSA implemented its Leadership Development Strategy, which included providing self-awareness tools to support the development of core competencies and character attributes among its management community, as well as embedding character-based leadership within executive staffing practices. The Agency's 2019 Public Service Employee Survey results demonstrate progress in this area, with a 9% increase in positive responses relating to trust and confidence in senior management compared to the previous year.
Recognizing that the CBSA's renewal efforts will only succeed through its people, the Agency embarked on a transformation of its culture, including a nationwide employee engagement tour hosted by the Agency's senior leadership in order to gather employee feedback and identify opportunities for improvement. This tour informed a comprehensive diagnostic of the Agency's current culture, as well as a strategy to ensure a productive, adaptive and healthy work environment. Efforts were also undertaken to build the Agency's change management capacity through the delivery of targeted training for executives and project managers, as well as direct change management support for major projects.
Collectively, the Agency's efforts to strengthen leadership development and workplace culture served to address enterprise risks in these areas by supporting management competencies to successfully guide the Agency through periods of change, as well as promoting greater acknowledgment of the individual and organizational change that is necessary to shape the Agency's desired culture.
Finally, the CBSA also implemented the Computer Sciences Professional Development Program which offers a standardized framework and toolset to foster employee learning opportunities and career development, thereby enhancing the supply and retention of employees in the Agency's IT community.
Ensuring a modern and sustainable fleet
In 2019 to 2020, the CBSA:
- Acquired 165 new vehicles within a budget allocation of $6.35 million
- Added 21 Hybrid Electric Vehicles and six Plug-in Electric Vehicles to the fleet, which will result in savings of roughly $14,000 in fuel and maintenance costs over the lifecycle of these vehicles
- Added one Hydrogen Fuel Cell Electric Vehicle to support operations in the Quebec region
- Added 116 telematics devices to CBSA vehicles to capture automated odometer readings and other data
- Installed 5 charging stations to support continued greening of the fleet
- Acquired one new marine vessel within a budget allocation of $700,000 to support CBSA operations in the Pacific region
Advancing the CBSA's transformation agenda
In 2019 to 2020, the CBSA advanced its five-year Sustainability and Modernization Plan, including finalizing the implementation of the Agency's new results-based organizational structure, introducing a national reporting structure for the Agency's internal services to improve consistency and efficiency across all regions, and reallocating resources to support the Agency's renewal activities. By year-end, one third of the Agency's sustainability initiatives had achieved closure, while its modernization initiatives had progressed through early project planning phases.
The CBSA implemented an Agency-wide business planning process, enabling integration and oversight of program activities across all business functions and laying the foundation for results-based program management going forward. The Agency also continued to enhance its financial governance through the ongoing implementation of multi-year budget management in support of integrated business planning, strategic procurement, effective asset lifecycle management, and enhanced budget transparency and accountability. For example, the Agency incorporated investment planning within the integrated business planning process and created an Efficiency and Modernization Committee to strengthen governance of investments and benefits. The Agency also implemented improvements to quarterly financial reporting to strengthen financial management across all branches and regions. These key steps served to address enterprise risks around business planning by enhancing the Agency's ability to manage resources effectively and reducing the potential for budget lapses.
As part of ongoing efforts to optimize the Agency's IT ecosystem, the Agency continued developing strategies to ensure that sufficient capacity is provisioned to meet expected program growth, including planning for shared infrastructure with Shared Services Canada (SSC) and the Canada Revenue Agency (CRA).
In 2019 to 2020, SSC reached out to the CBSA and CRA with a proposal for evergreening of aging and end-of-life IT infrastructure. SSC acknowledged that it was their responsibility to maintain this equipment and to replace it when necessary; however, their budget was insufficient and they were forced to reach out to partner organizations for financial assistance. SSC's final proposal was presented to the CBSA in and included major infrastructure equipment common to both the CBSA and CRA, with a total dollar value of approximately $7 million. Additionally, complications due to the onset of COVID-19 led to delays in the delivery of approximately $4.3 million worth of the IT refresh equipment that was purchased, which caused a subsequent expense to be carried over to 2020 to 2021. Moving forward, the CBSA will work with SSC to establish the description of relevant CBSA services that are covered by SSC through the ongoing appropriation and to identify which services are incremental.
The Agency also advanced contingency planning to ensure preparedness in the event of a disruption in the IT environment, as well as enhancements to existing IT infrastructure such as:
- upgrading the Agency's operating system and server platform
- increasing bandwidth and remote connectivity
- replacing depreciated devices
- improving network performance monitoring tools
In addition, the Agency advanced work to establish cloud computing platforms, as well as efforts to improve IT tools including query optimization at the Agency's National Targeting Centre. Over the next three years, the Agency will execute 20 rationalization and optimization initiatives to reduce the approximately $300 million in accumulated technical debt. Collectively, these efforts served to address enterprise risks in the IT environment by strengthening the resilience of the Agency's IT systems and support structures.
Finally, the CBSA continued to partner with Public Services and Procurement Canada to modernize the Agency's office accommodations and reduce its back office footprint, with several regional consolidation projects substantially advanced or completed in 2019 to 2020.
Additional achievements related to internal services
- From an environmental perspective, the Agency implemented its renewed Departmental Sustainable Development Strategy for 2020 to 2023 and achieved a reduction in greenhouse gas emissions of approximately 20,000 kg.
- From a personnel perspective, the Agency achieved a 97% reduction of in its security screening backlog.
- From a real property perspective, the Agency completed the consolidation of its Halifax regional offices, generating savings of approximately $780,000.
| Main estimates | 376,180,128 |
|---|---|
| Planned spending | 376,180,128 |
| Total authorities available for use | 434,470,132 |
| Actual spending (authorities used) | 383,716,218 |
| Difference (actual spending minus planned spending) | 7,536,090 |
| Planned full-time equivalents | 2,316 |
|---|---|
| Actual full-time equivalents | 2,355 |
| Difference (actual full-time equivalents minus planned full-time equivalents) | 39 |
Financial, human resources and performance information for the CBSA's Program Inventory is available in the GC InfoBase.
Analysis of trends in spending and human resources
Actual expenditures
Departmental spending trend
The following graph shows trends in the CBSA's actual and planned spending over time.
| 2017 to 2018 | 2018 to 2019 | 2019 to 2020 | 2020 to 2021 | 2021 to 2022 | 2022 to 2023 | |
|---|---|---|---|---|---|---|
| Statutory | 160 | 208 | 193 | 207 | 189 | 185 |
| Voted | 1,608 | 1,947 | 1,871 | 2,000 | 1,753 | 1,632 |
| Total | 1,768 | 2,155 | 2,064 | 2,207 | 1,942 | 1,817 |
| Core responsibilities and internal services | 2019 to 2020 Main estimates |
2019 to 2020 Planned spending |
2020 to 2021 Planned spending |
2021 to 2022 Planned spending |
2019 to 2020 Total authorities available for use |
2019 to 2020 Actual spending (authorities used) |
2018 to 2019 Actual spending (authorities used) |
2017 to 2018 Actual spending (authorities used)Footnote 14 |
|---|---|---|---|---|---|---|---|---|
| Border Management | 1,282,523,110 | 1,282,523,110 | 1,563,726,537 | 1,325,884,872 | 1,696,498,075 | 1,436,288,374 | 1,552,597,517 | N/A |
| Border Enforcement | 206,693,897 | 206,693,897 | 308,579,911 | 290,400,598 | 246,790,732 | 244,335,415 | 246,601,136 | N/A |
| Budget Implementation | 261,833,788 | N/A | N/A | N/A | 54,930,356 | N/A | N/A | N/A |
| Subtotal | 1,751,050,795 | 1,489,217,007 | 1,872,306,448 | 1,616,285,470 | 1,998,219,163 | 1,680,623,789 | 1,799,198,653 | 1,378,251,074 |
| Internal Services | 376,180,128 | 376,180,128 | 334,961,387 | 326,059,402 | 434,470,132 | 383,716,218 | 355,739,030 | 390,184,268 |
| Total | 2,127,230,923 | 1,865,397,135 | 2,207,267,835 | 1,942,344,872 | 2,432,689,295 | 2,064,340,007 | 2,154,937,683 | 1,768,435,342 |
The CBSA's 2019 to 2020 Main Estimates included $261.8 million under the Budget Implementation Vote for 2019 budget measures. These measures were not included in the 2019 to 2020 planned spending as they were not finalized at the time of the 2019 to 2020 Departmental Plan preparation. The following initiatives make up the $261.8 million:
- Addressing the challenges of African swine fever
- Enhancing accountability and oversight of the CBSA
- Enhancing the integrity of Canada's borders and asylum system
- Helping travellers visit Canada
- Modernizing Canada's border operations
- Protecting people from unscrupulous immigration consultants
In 2019 to 2020, the Agency's appropriation throughout the fiscal year increased by $305.5 million. Of this amount, $70.2 million increased by way of the Supplementary Estimates, which is mainly attributable to the following initiatives:
- Implementation and ongoing management of the CARM project
- Enhancing the Passenger Protect Program
- Strengthening service performance and compliance assurance for the Duties Relief Program and Duty Drawback Program
- Supporting the National Strategy to Combat Human Trafficking
- Supporting the 2019 to 2021 Immigration Levels Plan
- Strengthening Canada's sanctions capacity
In addition to this increase, the Agency received transfers of $24.9 million from TBS central votes for the reimbursement of costs related to severance payments, parental benefits, vacation credits and collective agreements. Lastly, the Agency received $211.2 million of the previous year's unused authorities for projects, integrity funding and increases to collective agreements, as per the Agency's two-year appropriation. Over the next three years, the Agency's spending will fluctuate due to the realignment of funding to meet revised project timelines, as well as changes in funding for government-wide initiatives.
In 2019 to 2020, the actual spending was $368.3 million less than the total authorities available, of which $79.8 million relates to specific lapses and re-profiles, while the remaining balance of $288.5 million will be made available for use in 2020 to 2021.
Of the $288.5 million carry-forward amount:
- $147.2 million has been provisioned in 2020 to 2021 through the Agency's financial management governance
- $108.1 million is encumbered for projects as a result of revisions to their implementation timelines
- $31.6 million is available for in-year priorities
- $1.6 million is frozen pending fulfillment of conditions
Of the $79.8 million lapsed amount:
- $54.9 million relates to the 2019 Budget Implementation Vote for withheld and remaining amounts, including statutory expenditures for Employee Benefit Plans and amounts set aside to cover costs of office accommodations and IT services
- $13.0 million is permanently frozen to account for conversion costs, special purposes initiatives, and funding for which the conditions to release have passed
- $11.9 million has been re-profiled into future fiscal years
Actual human resources
| Core responsibilities and internal services | 2017 to 2018 Actual full-time equivalentsFootnote 15 |
2018 to 2019 Actual full-time equivalents |
2019 to 2020 Planned full-time equivalents |
2019 to 2020 Actual full-time equivalents |
2020 to 2021 Planned full-time equivalents |
2021 to 2022 Planned full-time equivalents |
|---|---|---|---|---|---|---|
| Border Management | N/A | 10,128 | 10,551 | 10,455 | 10,959 | 10,625 |
| Border Enforcement | N/A | 1,541 | 1,378 | 1,665 | 1,980 | 1,887 |
| Subtotal | 11,029 | 11,669 | 11,929 | 12,120 | 12,939 | 12,512 |
| Internal Services | 2,499 | 2,287 | 2,316 | 2,355 | 2,096 | 2,116 |
| Total | 13,528 | 13,956 | 14,245 | 14,475 | 15,035 | 14,628 |
Prior to 2018 to 2019, due to increasing volumes and operational demands, the Agency undertook cost containment measures to address long-term staffing needs while it underwent a comprehensive program review. In the short term, human resource measures were put in place with regard to backfilling non-frontline staff and a revised staffing approval process was implemented.
In 2018 to 2019, through the Supplementary Estimates and Budget 2018 process, the Agency was directed to take on new initiatives. As a result, the Agency's actual and planned FTEs for 2018 to 2019 increased due to staffing requirements in support of following initiatives:
- Managing irregular migration at the Canada-US border, supporting decision-making capacity at the IRB, and supporting the strategy to deter irregular migration
- Supporting activities related to Division 9 of the Immigration and Refugee Protection Act
- Addressing the workload associated with the 2018 Immigration Levels Plan
- Enhancing the Passenger Protect Program
- Implementing improvements to the Steel Import Monitoring Program as well as investigative and compliance activities
- Implementing additional measures to help reduce opioid-related harms and deaths across Canada
- Implementing the Initiative to Take Action Against Gun and Gang Violence
In 2019 to 2020, through the Supplementary Estimates and Budget 2019 process, the Agency expects to continue increasing its FTEs over the next few years to support initiatives such as:
- Helping travellers visit Canada
- Addressing the challenges of African swine fever
- Implementation and ongoing management of the CARM project
- Enhancing the Passenger Protect Program
- Enhancing the Duties Relief Program and Duty Drawback Program
- Supporting the National Strategy to Combat Human Trafficking
- Supporting the 2019 to 2021 Immigration Levels Plan
- Enhancing the integrity of Canada's borders and asylum system
Expenditures by vote
For information on the CBSA's organizational voted and statutory expenditures, consult the Public Accounts of Canada 2019 to 2020.
Government of Canada spending and activities
Information on the alignment of the CBSA's spending with the Government of Canada's spending and activities is available in the GC InfoBase.
Financial statements and financial statements highlights
Financial statements
The CBSA's financial statements (unaudited) for the year ended are available on the Agency's website. For financial reporting purposes, the Agency's activities have been divided into two sets of financial statements:
- Agency Activities, comprising the operational revenues and expenses that are managed by the CBSA and utilized in operating the organization
- Administered Activities, comprising tax and non-tax revenues, assets and liabilities administered on behalf of the federal, provincial and territorial governments
One reason for the distinction between Agency Activities and Administered Activities is to facilitate the assessment of the Agency's administrative efficiency in delivering on its mandate.
Financial statements highlights
The Departmental Financial Statements are prepared on an accrual accounting basis in accordance with the Treasury Board Directive on Accounting Standards: GC 4500 Departmental Financial Statements, and include non-cash transactions. Financial information provided in other sections of this report is cash-based (planned and actual spending) and is tied to annual parliamentary appropriations (authorities).
| Financial information | 2019 to 2020 Planned results |
2019 to 2020 Actual results |
2018 to 2019 Actual results |
Difference (2019 to 2020 actual results minus 2019 to 2020 planned results) | Difference (2019 to 2020 actual results minus 2018 to 2019 actual results) |
|---|---|---|---|---|---|
| Total expenses | 2,125,398,000 | 2,257,720,000 | 2,348,920,000 | 132,322,000 | (91,200,000) |
| Total revenues | 18,430,000 | 27,975,000 | 24,120,000 | 9,545,000 | 3,855,000 |
| Net cost of operations before government funding and transfers | 2,106,968,000 | 2,229,745,000 | 2,324,800,000 | 122,777,000 | (95,055,000) |
The Agency's actual total expenses in 2019 to 2020 were $132.3 million (6.2%) more than planned mainly due to the following:
- Received $70.2 million to its appropriation through the 2019 to 2020 Supplementary Estimates for various initiatives
- Received $24.9 million more than planned in transfers from TBS central votes for the reimbursement of costs related to severance payments, parental benefits, vacation credits and collective agreements
- $20.7 million more services without charge than planned
The Agency's actual total expenses in 2019 to 2020 were $91.2 million (3.9%) less than in 2018 to 2019 as salaries and employee future benefits decreased by $137.1 million. Also, BSOs signed a new collective agreement in 2018 to 2019, resulting in salary expenses being unusually high that year.
The Agency's actual total revenues were $9.5 million (51.8%) higher than planned mainly because vote-netted revenues collected were $9.6 million higher than the $18.4 million approved by Treasury Board at the time the future-oriented statement of operations was prepared. In 2019 to 2020, Treasury Board approved an increase in vote-netted revenues from $18.4 million to $22.4 million.
The $3.9 million (16.0%) increase in total revenues in 2019 to 2020 relative to the previous year is mainly attributable to a $2.8 million increase in NEXUS program revenues.
| Financial information | 2019 to 2020 | 2018 to 2019 |
Difference (2019 to 2020 minus 2018 to 2019) |
|---|---|---|---|
| Total net liabilities | 395,781,000 | 410,374,000 | (14,593,000) |
| Total net financial assets | 223,916,000 | 248,066,000 | (24,150,000) |
| Departmental net debt | 171,865,000 | 162,308,000 | 9,557,000 |
| Total non-financial assets | 1,036,051,000 | 1,012,092,000 | 23,959,000 |
| Departmental net financial position | 864,186,000 | 849,784,000 | 14,402,000 |
The decrease of $14.6 million (3.6%) in total net liabilities is mainly attributable to a decrease of $25.1 million in accounts payable and accrued liabilities, and an increase of $10 million in vacation pay and compensatory leave.
The decrease of $24.1 million (9.7%) in total net financial assets is attributable to decrease of $26.7 million due from Consolidated Revenue Fund (CRF), which is mainly due to timing differences between the charging of authorities and the actual payment of cash for employee salaries and other payables.
The increase of $24 million (2.4%) in total non-financial assets can be attributed to the increase in tangible capital assets.
| Financial information | 2019 to 2020 | 2018 to 2019 |
Difference (2019 to 2020 minus 2018 to 2019) |
|---|---|---|---|
| Tax revenues | 32,480,027,000 | 35,347,801,000 | (2,867,774,000) |
| Non-tax revenues | 34,667,000 | 91,617,000 | (56,950,000) |
| Bad debt expense | 118,039,000 | 122,527,000 | (4,488,000) |
| Net results | 32,396,655,000 | 35,316,891,000 | (2,920,236,000) |
Note that, unlike the Condensed Statement of Operations for Agency Activities, the Condensed Statement of Administered Revenues for Administered Activities does not include planned results for 2019 to 2020 as it is not subject to the Treasury Board Directive on Accounting Standards: GC 4500 Departmental Financial Statements.
Total revenues reported within the financial statements for Administered Activities were $32 billion for 2019 to 2020, representing a decrease of $2.9 billion (8.26 %) relative to the total revenues of $35 billion for 2018 to 2019. These results are partly due to a decrease in excise taxes of approximately $779 million (2.89%), which is consistent with trade data from Statistics Canada showing a year-over-year decrease of 1.86% in the value of Canadian importations. An additional contributor to the decrease in total revenues is the decrease in customs import duties of $2.02 billion, mainly due to the repeal of countermeasures (surtaxes) on certain goods of US origin in response to the US tariff on certain Canadian steel and aluminum products.
The deferral of payments of GST and customs duties on imports due to COVID-19 (announced in and effective until ) does not affect administered revenues for 2019 to 2020.
| Financial information | 2019 to 2020 | 2018 to 2019 |
Difference (2019 to 2020 minus 2018 to 2019) |
|---|---|---|---|
| Total administered assets | 3,714,404,000 | 4,138,765,000 | (424,361,000) |
| Total administered liabilities | 281,697,000 | 323,159,000 | (41,462,000) |
| Net amount due to the CRF | 3,432,707,000 | 3,815,606,000 | (382,899,000) |
| Total administered liabilities and net amount due to the CRF | 3,714,404,000 | 4,138,765,000 | (424,361,000) |
The total administered assets have shown a decrease of 10.25% which is attributable to a combination of decreased economic activities and the timing of the collection of accounts receivable from external parties and related deposits to the CRF.
The total administered liabilities have shown a decrease of 12.83% compared to 2018 to 2019. The decrease in total administered liabilities is mainly attributable to a decrease in accounts payable to other government departments and agencies.
The deferral of payments of GST and customs duties on imports due to COVID-19 (announced in and effective until ) does not affect the total administered assets and liabilities for 2019 to 2020.
Additional information
Organizational profile
- Appropriate minister: The Honourable William Sterling Blair, P.C., C.O.M., M.P.
- Institutional head: John Ossowski
- Ministerial portfolio: Public Safety and Emergency Preparedness
- Enabling instruments:
- Year of incorporation/commencement: 2003
Raison d'être, mandate and role: who we are and what we do
The CBSA's raison d'être, mandate and role are available on its website. For more information on the Agency's organizational mandate letter commitments, see the Minister's mandate letter.
Reporting framework
The CBSA's Departmental Results Framework and Program Inventory of record for 2019 to 2020 are shown below.
Core Responsibility: Border Management
Departmental results framework
Result: The CBSA's intelligence, threat and risk assessment activities support CBSA programs in the identification and interception of high-risk people, goods, and conveyances that pose a threat to the security of Canadians
Indicators:
- Percentage of threats identified that lead to an enforcement action or inadmissibility recommendation
- Ratio of the value of intelligence-led seizures to the value of non-intelligence led seizures
Result: Admissible travellers are processed in an efficient manner
Indicators:
- Percentage of time the CBSA is meeting the Highway Border Wait Times (BWT) Service Standard
- Percentage of travellers using Primary Inspection Kiosks (PIK) at PIK-enabled airports
- Actual availability of Primary Inspection Kiosks as a percentage of planned availability
Result: Travellers and their goods are compliant with applicable legislation
Indicators:
- Percentage of traveller examinations that produced a result (enforcement or facilitation action)
- Percentage of traveller goods examinations that produced a result (enforcement or facilitation action)
Result: Admissible commercial goods and conveyances are processed (including the collection of revenues) in an efficient manner
Indicators:
- Percentage of time the CBSA met the commercial Highway Border Wait Time Service Standard
- Percentage of eligible release decisions provided within established timeframes
- Actual availability of Single Windows as a percentage of planned availability
Result: Trade partners are compliant with applicable legislation, requirements and measures
Indicators:
- Percentage of random commercial examinations that produced a result
- Percentage of high-risk commercial goods targeted by the National Targeting Center that are examined at the border
- Percentage of commercial examinations that produced a result against a trader
- Percentage of penalties applied against traders representing continued non-compliance
- Return on investment (ROI) for targeted verifications
- Percentage of revenue-based targeted trade compliance verifications that yielded a result
- Percentage of imports potentially subject to anti-dumping or countervailing duties verified to ensure compliance
Result: Trusted Traveller and Trader programs increase processing efficiency of low-risk, pre-approved travellers and trade partners
Indicators:
- Percentage of time the CBSA is meeting the NEXUS Highway BWT Service Standard
- Ratio of Trusted Travellers referred for examination compared to conventional travellers
- Percentage of Trusted Travellers in compliance with legislation and program regulations
- Ratio of conventional traders and their goods that are examined at the border compared to Trusted Traders and their goods
- Percentage of trade by value of goods imported into Canada by participants in CBSA's Trusted Trader programs
Result: Travellers and the business community have access to timely redress mechanisms
Indicator: Percentage of enforcement and trade appeals received that are decided within established service standards
Program inventory
- Targeting
- Intelligence Collection and Analysis
- Security Screening
- Traveller Facilitation and Compliance
- Commercial-Trade Facilitation and Compliance
- Trusted Traveller
- Trusted Trader
- Anti-dumping and Countervailing
- Recourse
- Force Generation
- Buildings and Equipment
- Field Technology Support
Core Responsibility: Border Enforcement
Internal services
Result: Immigration investigations identify persons inadmissible to Canada
Indicator: Percentage of immigration investigations concluded that result in a person being identified as inadmissible to Canada
Result: CBSA detention decisions are risk-based and detention is used as a measure of last resort
Indicator: Percentage of persons subject to detention for immigration purposes enrolled into alternative to detention programs
Result: CBSA admissibility recommendations and appeals are upheld at the Immigration and Refugee Board of Canada
Indicators:
- Percentage of inadmissibility referrals and appeals made to the Immigration and Refugee Board that result in an inadmissibility or ineligibility determination
- Percentage of Ministerial interventions (at the Refugee Protection Division and the Refugee Appeals Division) and appeals that result in a negative refugee determination
Result: Inadmissible persons subject to removal depart from Canada (i.e., escorted or unescorted)
Indicators:
- Number of persons subject to removal who voluntarily comply with their departure order
- Percentage of high priority foreign nationals removed (i.e., on grounds of serious inadmissibility such as criminality, war crimes, security)
- Median number of days to enforce a removal order from Canada
Result: People and businesses that are referred to Crown counsel for prosecution are convicted
Indicator: Percentage of prosecutions concluded that result in a conviction
Program inventory
- Immigration Investigations
- Detentions
- Hearings
- Removals
- Criminal Investigations
Supporting information on the program inventory
Financial, human resources and performance information for the CBSA's Program Inventory is available in the GC InfoBase.
Supplementary information tables
The following supplementary information tables are available on the CBSA's website:
- Departmental Sustainable Development Strategy
- Gender-based analysis plus
- Status report on transformational and major Crown projects
- Response to parliamentary committees and external audits
Federal tax expenditures
The tax system can be used to achieve public policy objReectives through the application of special measures such as low tax rates, exemptions, deductions, deferrals and credits. The Department of Finance Canada publishes cost estimates and projections for these measures each year in the Report on Federal Tax Expenditures. This report also provides detailed background information on tax expenditures, including descriptions, objectives, historical information and references to related federal spending programs. The tax measures presented in this report are the responsibility of the Minister of Finance.
Organizational contact information
The CBSA's contact information is available on its website.
Appendix: definitions
- Appropriation (crédit)
- Any authority of Parliament to pay money out of the Consolidated Revenue Fund.
- Budgetary expenditures (dépenses budgétaires)
- Operating and capital expenditures; transfer payments to other levels of government, organizations or individuals; and payments to Crown corporations.
- Core responsibility (responsabilité essentielle)
- An enduring function or role performed by a department. The intentions of the department with respect to a core responsibility are reflected in one or more related departmental results that the department seeks to contribute to or influence.
- Departmental plan (plan ministériel)
- A report on the plans and expected performance of an appropriated department over a 3 year period. Departmental Plans are usually tabled in Parliament each spring.
- Departmental priority (priorité)
- A plan or project that a department has chosen to focus and report on during the planning period. Priorities represent the things that are most important or what must be done first to support the achievement of the desired departmental results.
- Departmental result (résultat ministériel)
- A consequence or outcome that a department seeks to achieve. A departmental result is often outside departments' immediate control, but it should be influenced by program-level outcomes.
- Departmental result indicator (indicateur de résultat ministériel)
- A quantitative measure of progress on a departmental result.
- Departmental results framework (cadre ministériel des résultats)
- A framework that connects the department's core responsibilities to its departmental results and departmental result indicators.
- Departmental results report (rapport sur les résultats ministériels)
- A report on a department's actual accomplishments against the plans, priorities and expected results set out in the corresponding Departmental Plan.
- Experimentation (expérimentation)
- The conducting of activities that seek to first explore, then test and compare the effects and impacts of policies and interventions in order to inform evidence-based decision-making, and improve outcomes for Canadians, by learning what works, for whom and in what circumstances. Experimentation is related to, but distinct from innovation (the trying of new things), because it involves a rigorous comparison of results. For example, using a new website to communicate with Canadians can be an innovation; systematically testing the new website against existing outreach tools or an old website to see which one leads to more engagement, is experimentation.
- Full time equivalent (équivalent temps plein)
- A measure of the extent to which an employee represents a full person year charge against a departmental budget. For a particular position, the full time equivalent figure is the ratio of number of hours the person actually works divided by the standard number of hours set out in the person's collective agreement.
- Gender-based analysis plus (GBA+) (analyse comparative entre les sexes plus [ACS+])
- An analytical process used to assess how diverse groups of women, men and gender-diverse people experience policies, programs and services based on multiple factors including race ethnicity, religion, age, and mental or physical disability.
- Government-wide priorities (priorités pangouvernementales)
- For the purpose of the 2019 to 2020 Departmental Results Report, those high-level themes outlining the government's agenda in the 2019 Speech from the Throne, namely: Fighting climate change; Strengthening the Middle Class; Walking the road of reconciliation; Keeping Canadians safe and healthy; and Positioning Canada for success in an uncertain world.
- Horizontal initiative (initiative horizontale)
- An initiative where two or more federal organizations are given funding to pursue a shared outcome, often linked to a government priority.
- Non budgetary expenditures (dépenses non budgétaires)
- Net outlays and receipts related to loans, investments and advances, which change the composition of the financial assets of the Government of Canada.
- Performance (rendement)
- What an organization did with its resources to achieve its results, how well those results compare to what the organization intended to achieve, and how well lessons learned have been identified.
- Performance indicator (indicateur de rendement)
- A qualitative or quantitative means of measuring an output or outcome, with the intention of gauging the performance of an organization, program, policy or initiative respecting expected results.
- Performance reporting (production de rapports sur le rendement)
- The process of communicating evidence based performance information. Performance reporting supports decision making, accountability and transparency.
- Plan (plan)
- The articulation of strategic choices, which provides information on how an organization intends to achieve its priorities and associated results. Generally, a plan will explain the logic behind the strategies chosen and tend to focus on actions that lead to the expected result.
- Planned spending (dépenses prévues)
-
For Departmental Plans and Departmental Results Reports, planned spending refers to those amounts presented in Main Estimates.
A department is expected to be aware of the authorities that it has sought and received. The determination of planned spending is a departmental responsibility, and departments must be able to defend the expenditure and accrual numbers presented in their Departmental Plans and Departmental Results Reports.
- Program (programme)
- Individual or groups of services, activities or combinations thereof that are managed together within the department and focus on a specific set of outputs, outcomes or service levels.
- Program inventory (répertoire des programmes)
- Identifies all the department's programs and describes how resources are organized to contribute to the department's core responsibilities and results.
- Result (résultat)
- A consequence attributed, in part, to an organization, policy, program or initiative. Results are not within the control of a single organization, policy, program or initiative; instead they are within the area of the organization's influence.
- Statutory expenditures (dépenses législatives)
- Expenditures that Parliament has approved through legislation other than appropriation acts. The legislation sets out the purpose of the expenditures and the terms and conditions under which they may be made.
- Target (cible)
- A measurable performance or success level that an organization, program or initiative plans to achieve within a specified time period. Targets can be either quantitative or qualitative.
- Voted expenditures (dépenses votées)
- Expenditures that Parliament approves annually through an appropriation act. The vote wording becomes the governing conditions under which these expenditures may be made.
- Date modified: