
Canada Border Services Agency: Quarterly Financial Report—For the quarter ended September 30, 2021
Table of contents
- 1. Introduction
- 2. Highlights of fiscal quarter and fiscal year-to-date (YTD) results
- 3. Risks and uncertainties
- 4. Significant changes in relation to operations, personnel and programs
- 5. Approval by senior officials
- 6. Table 1: Statement of authorities (unaudited)
- 7. Table 2: Departmental budgetary expenditures by standard object (unaudited)
1. Introduction
This Quarterly Financial Report (QFR) has been prepared as required by section 65.1 of the Financial Administration Act and in the form and manner prescribed by the Treasury Board. This quarterly report should be read in conjunction with the Main Estimates, Canada's Economic Action Plan 2020 (Budget 2020) and Canada's COVID-19 Economic Response Plan.
Information on the 'raison d'être', mandate, role and core responsibilities of the Canada Border Services Agency (CBSA) can be found in Part III Departmental Plan and Part II of the Main Estimates.
The QFR has not been subjected to an external audit or review, but has been reviewed internally by the departmental Audit Committee.
1.1 Basis of presentation
This quarterly report has been prepared by management using an expenditure basis of accounting. The accompanying statement of authorities (Table 1) includes the department's spending authorities granted by Parliament, and those used by the department consistent with the Main Estimates and Supplementary Estimates (as applicable) for the 2020 to 2021 and 2021 to 2022 fiscal years. Please note that in the second quarter of 2020 to 2021, CBSA had received 9/12th of its total funding due to delays caused by the COVID-19 pandemic. This quarterly report has been prepared using a special purpose financial reporting framework designed to meet financial information needs with respect to the use of spending authorities.
The authority of Parliament is required before money can be spent by the Government. Approvals are given in the form of annually approved limits through appropriation acts, or through legislation in the form of statutory spending authority for specific purposes.
When Parliament is dissolved for the purposes of a general election, section 30 of the Financial Administration Act authorizes the Governor General, under certain conditions, to issue a special warrant authorizing the Government to withdraw funds from the consolidated revenue fund. A special warrant is deemed to be an appropriation for the fiscal year in which it is issued.
The department uses the full accrual method of accounting to prepare and present its annual departmental financial statements that are part of the departmental results reporting process. However, the spending authorities voted by Parliament remain on an expenditure basis.
2. Highlights of fiscal quarter and fiscal year-to-date (YTD) results
This section highlights the significant items that contributed to the net increase or decrease in resources available for the year and actual expenditures as of the quarter ended .

Image description
Graph 1: Comparison of net budgetary authorities and expenditures as of
and
(in thousands $)
| 2020 to 2021 | 2021 to 2022 | |
|---|---|---|
| Net budgetary authorities | 1,995,944 | 2,406,080 |
Expenditures for the quarter ending September 30 |
498,460 | 554,323 |
Expenditures for the quarter ending June 30 |
433,101 | 466,375 |
| Total Expenditures to date | 931,561 | 1,020,698 |
| For the period ending , the authorities provided to the CBSA comprise of 9/12th of the 2020 to 2021 Main Estimates, due to changes in the operations of Parliament caused by the COVID-19 pandemic. | ||
2.1 Significant changes to authorities
For the period ending , the authorities provided to the CBSA comprise of the Main Estimates, Supplementary Estimates (A), Treasury Board (TB) approved Budget 2020 measures and any unused spending authorities carried forward from the previous fiscal year.
The Statement of authorities (Table 1) presents a net increase of $410.1 million or 20.5% of the agency’s total authorities of $2,406.1 million at September 30, 2021 compared to $1,995.9 million total authorities at the same quarter last year.
This net increase in the authorities available for use is the result of an increase in Vote 1 – Operating Expenditures of $451.9 million, a decrease in Vote 5 – Capital of $25.8 million and a decrease in budgetary statutory authorities of $16.0 million.
Vote 1 – Operating
The Agency’s Vote 1 Operating increased by $451.9 million or 29.1%, which is attributed to the net effect of the following significant items (excluding the statutory authorities):
Increases are mainly attributed to:
- $388.1 million in increases as described in the CBSA Quarterly Financial Report for the quarter ended June 30, 2021;
- $61.8 million in increases due to a larger carry forward of unused spending authorities; and
- $2.0 million increase for the Application Modernization Initiative.
Vote 5 – Capital
The Agency’s Vote 5 Capital decreased by $25.8 million or 10.9%, which is attributed to the net effect of the following significant items:
Decreases are mainly attributed to:
- $20.9 million in decreases as described in the CBSA Quarterly Financial Report for the quarter ended June 30, 2021; and
- $4.9 million decreases due to a smaller carry forward of unused spending authorities.
Budgetary statutory authorities
The agency's Statutory Authority related to the employee benefit plan (EBP) decreased by $16.0 million, or 7.7% from the previous year.
2.2 Explanations of significant variances in expenditures from previous year
As indicated in the statement of authorities (Table 1), the agency’s expenditures for year-to-date, at quarter end September 30, 2021 were $1,020.7 million, as compared to $931.6 million for year-to-date, quarter ending September 30, 2020. The net increase of $89.1 million or 9.6% in expenditures is mainly due to the following items:
- Increase of $101.9 million or 13.1% in Vote 1 Operating Expenditures year-to-date used at quarter end. The increase in expenditures is mainly attributed to the following items:
- $29.0 million increase for Shared Services – Information Technology;
- $19.6 million increase in vacation expenses for indeterminate employees;
- $11.1 million increase in Overtime payments;
- $9.8 million increase in various salaries;
- $8.5 million increase in Information Technology Consultants;
- $5.3 million increase in building protection services;
- $4.3 million increase in Computer Software expenses;
- $3.3 million increase in other consulting services; and
- $10.2 million in other miscellaneous items.
- Decrease of $4.8 million or 9.7% in Vote 5 Capital Expenditures year-to-date used at quarter end. The decrease in expenditures is mainly attributed to an $8.7 million decrease in Information Technology Consultants that is offset by a $4.0 million increase in Capital Projects.
- Decrease of $8.0 million in statutory expenditures year-to-date used at quarter end.
As indicated in the departmental budgetary expenditures by standard object (Table 2), the net increase by standard object are mainly attributed to:
- Increase of $36.6 million for Personnel due to vacation expenses, salaries and overtime pay. Which can be mainly attributed to a $19.6 million increase in Vacation Expense for Indeterminate employees and a $15.6 million increase in Total Overtime.
- Increase of $6.5 million for Transportation and Communications. Which can be attributed to a $5.0 million increase in total travel and a $0.9 million increase for Mobile Radios as well as a $0.5 million increase in total relocation expenses.
- Increase of $39.7 million for Professional and Special Services can be mainly attributed to a $29.0 million increase in Shared Services – Information Technology, a $5.4 million increase in Building Protection Services and a $3.8 million increase in Other Consulting Services.
- Increase of $3.3 million in Acquisition of land, buildings and equipment for Facilities Capital Projects.
- Increase of $2.1 million in Acquisition of machinery and equipment can be attributed to a $4.3 million increase Computer Software Expense which is offset by a $1.4 million decrease in Laboratory and Medical Equipment and Parts and a $0.6 million decrease in Computer Equipment Desktop/Personal/Portable expense.
- Decrease of $2.0 million in Other subsidies and payments which can be mainly attributed to the $3.0 million decrease in Salary Overpayments for inactive employees which is offset by a $0.9 million increase in Damages and Other Claims Against the Crown.
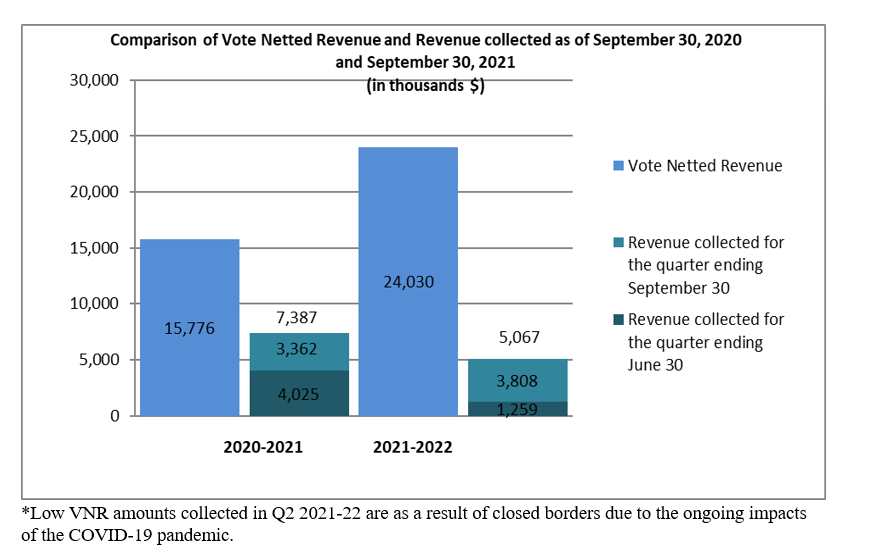
Image description
Graph 2: Comparison of vote netted revenue and revenue collected as of and
(in thousands $)
| 2020 to 2021 | 2021 to 2022 | |
|---|---|---|
| Vote netted revenue | 15,776 | 24,030 |
Revenue collected for the quarter ending September 30 |
3,362 | 3,808 |
Revenue collected for the quarter ending June 30 |
4,025 | 1,259 |
| Total Revenue collected to date | 7,387 | 5,067 |
| Low VNR amounts collected in Quarter 2 of 2021 to 2022 are as a result of closed borders due to the ongoing impacts of the COVID-19 pandemic. | ||
The planned revenue from the sales of services reflects the agency’s revenue respending authority. The year-to-date revenue from the charge of services has decreased by $2.3 million or 31.4% due to the ongoing impacts of the COVID-19 pandemic.
3. Risks and uncertainties
The CBSA’s changing operating environment makes the agency particularly susceptible to external drivers that are largely beyond its control. Together, these drivers have the potential to affect the organization’s ability to adhere to its annual financial plan.
The agency is pursuing several large information technology (IT) and physical infrastructure projects. Most are multi-year in nature and represent substantial investments. The COVID-19 pandemic necessitated a re-prioritization of certain agency activities to address pressing matters, which may result in scheduling delays for some projects.
In addition, because the CBSA depends on other government departments and/or external stakeholders for the development and implementation of many of its major projects, scheduling delays are even more likely. As each organization must also manage the repercussions the COVID-19 pandemic is having on its own operations, assisting the CBSA in the advancement of its projects in a timely basis can become challenging due to conflicting priorities. Despite these conditions, the Agency has met key deadlines and deliverables on many of the major projects currently underway and is on track for the next set of deliverables.
Beyond the effects of re-prioritization on the way resources are allotted, the COVID-19 pandemic will also likely prompt a need for adjustments to the design of certain projects, which could further delay the execution and delivery of said projects and result in funding lapses.
Delays can lead to other challenges as project costing does not always allow for fluctuating costs for materials, commodities and other market rate price changes. Inflation also drives up costs on deferred or delayed projects.
The agency strives to mitigate financial risks by risk-rating its projects, conducting periodic project reviews, and by holding regular budget discussions. Such activities are informed and supported by agency quarterly integrated project reporting processes.
4. Significant changes in relation to operations, personnel and programs
4.1 Key senior personnel
Ted Gallivan was appointed as the new Executive Vice-President of the Canada Border Services Agency, effective .
Fred Gaspar has been appointed as the new Vice-President of the Commercial and Trade Branch, effective .
4.2 Operations
The Canadian border was re-opened to U.S. citizens on , and to any travellers on who are fully-vaccinated and meet other specific entry requirements. While the further verification steps required by new safety protocols have increased processing times at points of entry, traveler volumes have not increased to pre-pandemic levels, due largely to the U.S. land border remaining closed to non-U.S. citizens. Ongoing, increased commercial volumes remained unaffected by these changes.
The COVID-19 pandemic also prompted a transition to telework for thousands of non-frontline employees. This has brought about new methods for communicating and collaborating, and while some limitations exist, the IT infrastructure has largely been able to successfully support this transition. Preparation is under way to integrate this new way of working into a future hybrid work model as the Agency transitions to a post-pandemic world later this year.
5. Approval by senior officials
Approved by:
John Ossowski
President
Ottawa, Canada
Date:
Jonathan Moor
Chief Financial Officer
Ottawa, Canada
Date:
6. Table 1: Statement of authorities (unaudited)
| Total available for use for the year ending Tablenote 1 | Used during the quarter ended | Year-to-date used at quarter end | |
|---|---|---|---|
| Vote 1: Operating expenditures | 2,005,297 | 483,011 | 880,908 |
| Vote 5: Capital expenditures | 210,197 | 23,623 | 44,443 |
| Statutory authority: Contributions to employee benefit plans | 190,586 | 47,647 | 95,293 |
| Statutory authority: Refunds of amounts credited to revenues in previous years | 0 | 0 | 1 |
| Statutory authority: Spending of proceeds from the disposal of surplus Crown assets | 0 | 43 | 53 |
| Total budgetary authorities | 2,406,080 | 554,323 | 1,020,698 |
| Non-budgetary authorities | 0 | 0 | 0 |
| Total authorities | 2,406,080 | 554,323 | 1,020,698 |
| Total available for use for the year ending Tablenote 2 | Used during the quarter ended | Year-to-date used at quarter end | |
|---|---|---|---|
| Vote 1: Operating expenditures | 1,553,378 | 412,451 | 779,045 |
| Vote 5: Capital expenditures | 235,979 | 34,362 | 49,222 |
| Statutory authority: Contributions to employee benefit plans | 206,587 | 51,647 | 103,294 |
| Statutory authority: Refunds of amounts credited to revenues in previous years | 0 | 0 | 0 |
| Statutory authority: Spending of proceeds from the disposal of surplus Crown assets | 0 | 0 | 0 |
| Total budgetary authorities | 1,995,944 | 498,460 | 931,561 |
| Non-budgetary authorities | 0 | 0 | 0 |
| Total authorities | 1,995,944 | 498,460 | 931,561 |
7. Table 2: Departmental budgetary expenditures by standard object (unaudited)
| Planned expenditures for the year ending Tablenote 3 | Expended during the quarter ended | Year-to-date used at quarter end | |
|---|---|---|---|
| Expenditures | |||
| Personnel | 1,696,380 | 401,283 | 786,864 |
| Transportation and communications | 64,127 | 8,787 | 13,877 |
| Information | 1,831 | 278 | 485 |
| Professional and special services | 396,953 | 112,477 | 168,019 |
| Rentals | 14,516 | 2,556 | 3,766 |
| Repair and maintenance | 36,659 | 6,455 | 10,353 |
| Utilities, materials and supplies | 20,124 | 3,678 | 6,541 |
| Acquisition of land, buildings and works | 90,035 | 9,425 | 18,489 |
| Acquisition of machinery and equipment | 99,990 | 8,505 | 11,429 |
| Transfer payments | 0 | 0 | 0 |
| Other subsidies and payments | 9,495 | 4,687 | 5,942 |
| Total gross budgetary expeditures | 2,430,110 | 558,131 | 1,025,765 |
| Less revenues netted against expenditures | |||
| Sales of services | 24,030 | 3,808 | 5,068 |
| Other revenue | 0 | 0 | -1 |
| Total revenues netted against expenditures | 24,030 | 3,808 | 5,067 |
| Total net budgetary expenditures | 2,406,080 | 554,323 | 1,020,698 |
| Planned expenditures for the year ending Tablenote 4 | Expended during the quarter ended | Year-to-date used at quarter end | |
|---|---|---|---|
| Expenditures | |||
| Personnel | 1,438,786 | 379,627 | 750,275 |
| Transportation and communications | 40,594 | 5,036 | 7,363 |
| Information | 1,016 | 326 | 580 |
| Professional and special services | 259,559 | 83,823 | 128,291 |
| Rentals | 8,422 | 2,750 | 3,768 |
| Repair and maintenance | 25,741 | 5,582 | 9,752 |
| Utilities, materials and supplies | 11,572 | 3,820 | 6,583 |
| Acquisition of land, buildings and works | 107,992 | 13,230 | 15,158 |
| Acquisition of machinery and equipment | 111,587 | 5,536 | 9,286 |
| Transfer payments | 0 | 0 | 0 |
| Other subsidies and payments | 6,451 | 2,092 | 7,892 |
| Total gross budgetary expenditure | 2,011,720 | 501,822 | 938,948 |
| Less revenues netted against expenditures | |||
| Sales of services | 15,776 | 3,362 | 7,387 |
| Other revenue | 0 | 0 | 0 |
| Total revenues netted against expenditures | 15,776 | 3,362 | 7,387 |
| Total net budgetary expenditures | 1,995,944 | 498,460 | 931,561 |
- Date modified: